Posted on Leave a comment

NASA Deep Space Network’s New Goldstone Antenna Goes Online

1 Min Read

NASA Deep Space Network’s New Goldstone Antenna Goes Online

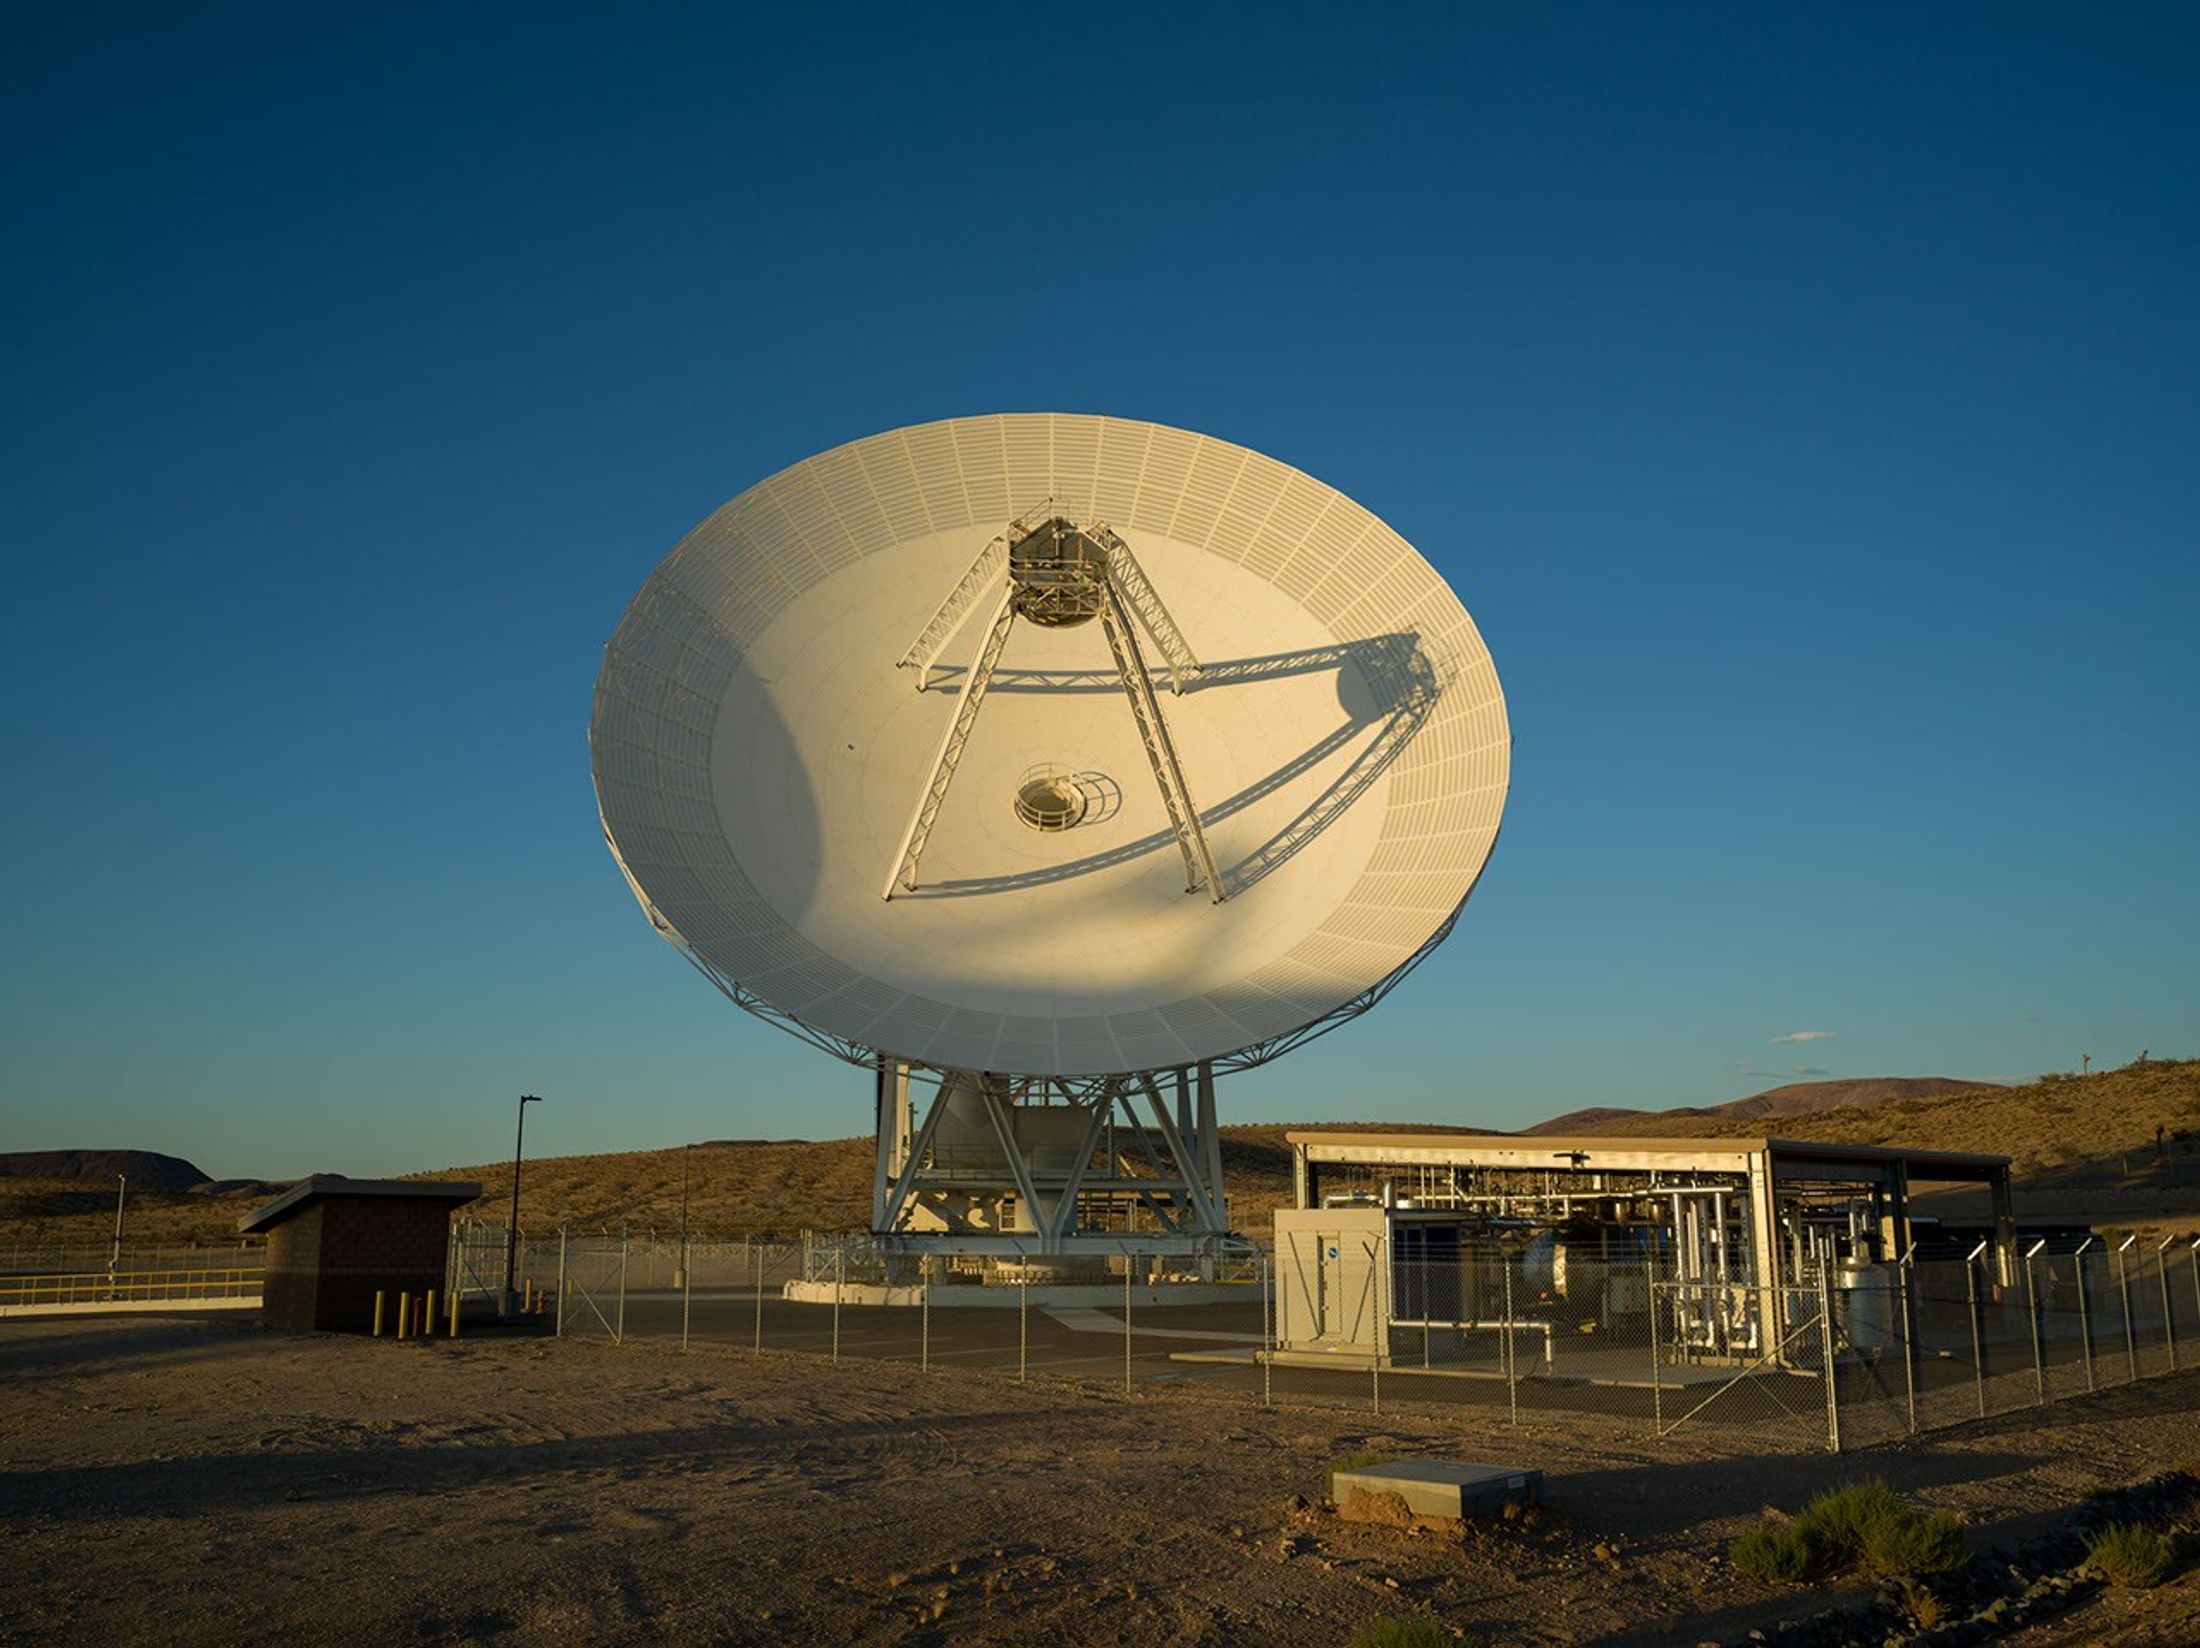
A massive white satellite dish antenna stands on a desert plain under a clear blue sky, bathed in warm sunlight alongside small facility structures.

PIA26778

Credits:
NASA/JPL-Caltech

Description

Long shadows are cast by the recently completed Deep Space Station 23 at the Deep Space Network’s Goldstone complex near Barstow, California, in August 2026. A 34-meter (114-foot) multifrequency beam-waveguide antenna, DSS-23 will boost the DSN’s capacity and enhance NASA’s deep space communications capabilities for decades to come.

NASA leadership and personnel as well as dignitaries gathered at the complete DSS-23 antenna for a ceremonial ribbon cutting on Aug. 25, 2026. It’s the latest antenna to be added as part of the Deep Space Network’s Aperture Enhancement Project, which began in 2009 to upgrade and expand the network by adding six new 34-meter multifrequency beam-waveguide antennas. These versatile Deep Space Network dishes can enhance many missions operating over different radio frequencies. 

The DSN allows missions to track, send commands to, and receive scientific data from faraway spacecraft. It is managed by NASA’s Jet Propulsion Laboratory, a division of Caltech, in Southern California for the agency’s Space Communications and Navigation (SCaN) Program, which is located at NASA Headquarters within the Research and Technology Mission Directorate.

For more information about the DSN, visit:

https://www.nasa.gov/communicating-with-missions/dsn/

Source: science.nasa.gov

Posted on Leave a comment

Ribbon-Cutting Event for NASA Deep Space Network’s Deep Space Station 23

2 Min Read

Ribbon-Cutting Event for NASA Deep Space Network’s Deep Space Station 23

Ten people in professional attire pose together outside under a clear blue sky, with a massive white satellite dish standing directly behind them.

PIA26779

Credits:
NASA/JPL-Caltech

Description

Leadership from NASA Headquarters, the Jet Propulsion Laboratory, and the Deep Space Network (DSN) stand in front of the recently completed Deep Space Station 23 antenna at the Deep Space Network’s Goldstone complex near Barstow, California, on Aug. 25, 2026. 

From left: Germaine Aziz (project manager, DSN Aperture Enhancement Project, JPL); Bradford Arnold (manager, Telecom Programs & Oversight, JPL); Keyur Patel (associate lab director for Flight Projects & Mission Success, JPL); Wanda Peters (deputy associate administrator, Research and Technology Mission Directorate, NASA Headquarters); Jimmy Kenyon (associate administrator, RTMD, NASA Headquarters); John McCullough (acting director, Space Communications and Navigation Program, NASA Headquarters); Gregory Heckler (deputy program manager for capability development, SCaN, NASA Headquarters); William Marinelli (development manager, SCaN, NASA Headquarters), Michael Levesque (project manager, DSN, JPL); and Frank Kaufholod (project manager, NASA Glenn Research Center).

They gathered at the recently completed DSS-23 antenna for a ceremonial ribbon cutting on Aug. 25, 2026. It’s the latest antenna to be added as part of the DSN’s Aperture Enhancement Project, which began in 2009 to upgrade and expand the network by adding six new 34-meter (114-foot) multifrequency beam-waveguide antennas. These versatile Deep Space Network dishes can enhance many missions operating over different radio frequencies. 

The DSN allows missions to track, send commands to, and receive scientific data from faraway spacecraft. It is managed by JPL, a division of Caltech, in Southern California for SCaN, which is located at NASA Headquarters within RTMD.

For more information about the DSN, visit:

https://www.nasa.gov/communicating-with-missions/dsn/

Source: science.nasa.gov

Posted on Leave a comment

NASA Data Feeds River Forecasts as Snow Drought Effects Linger

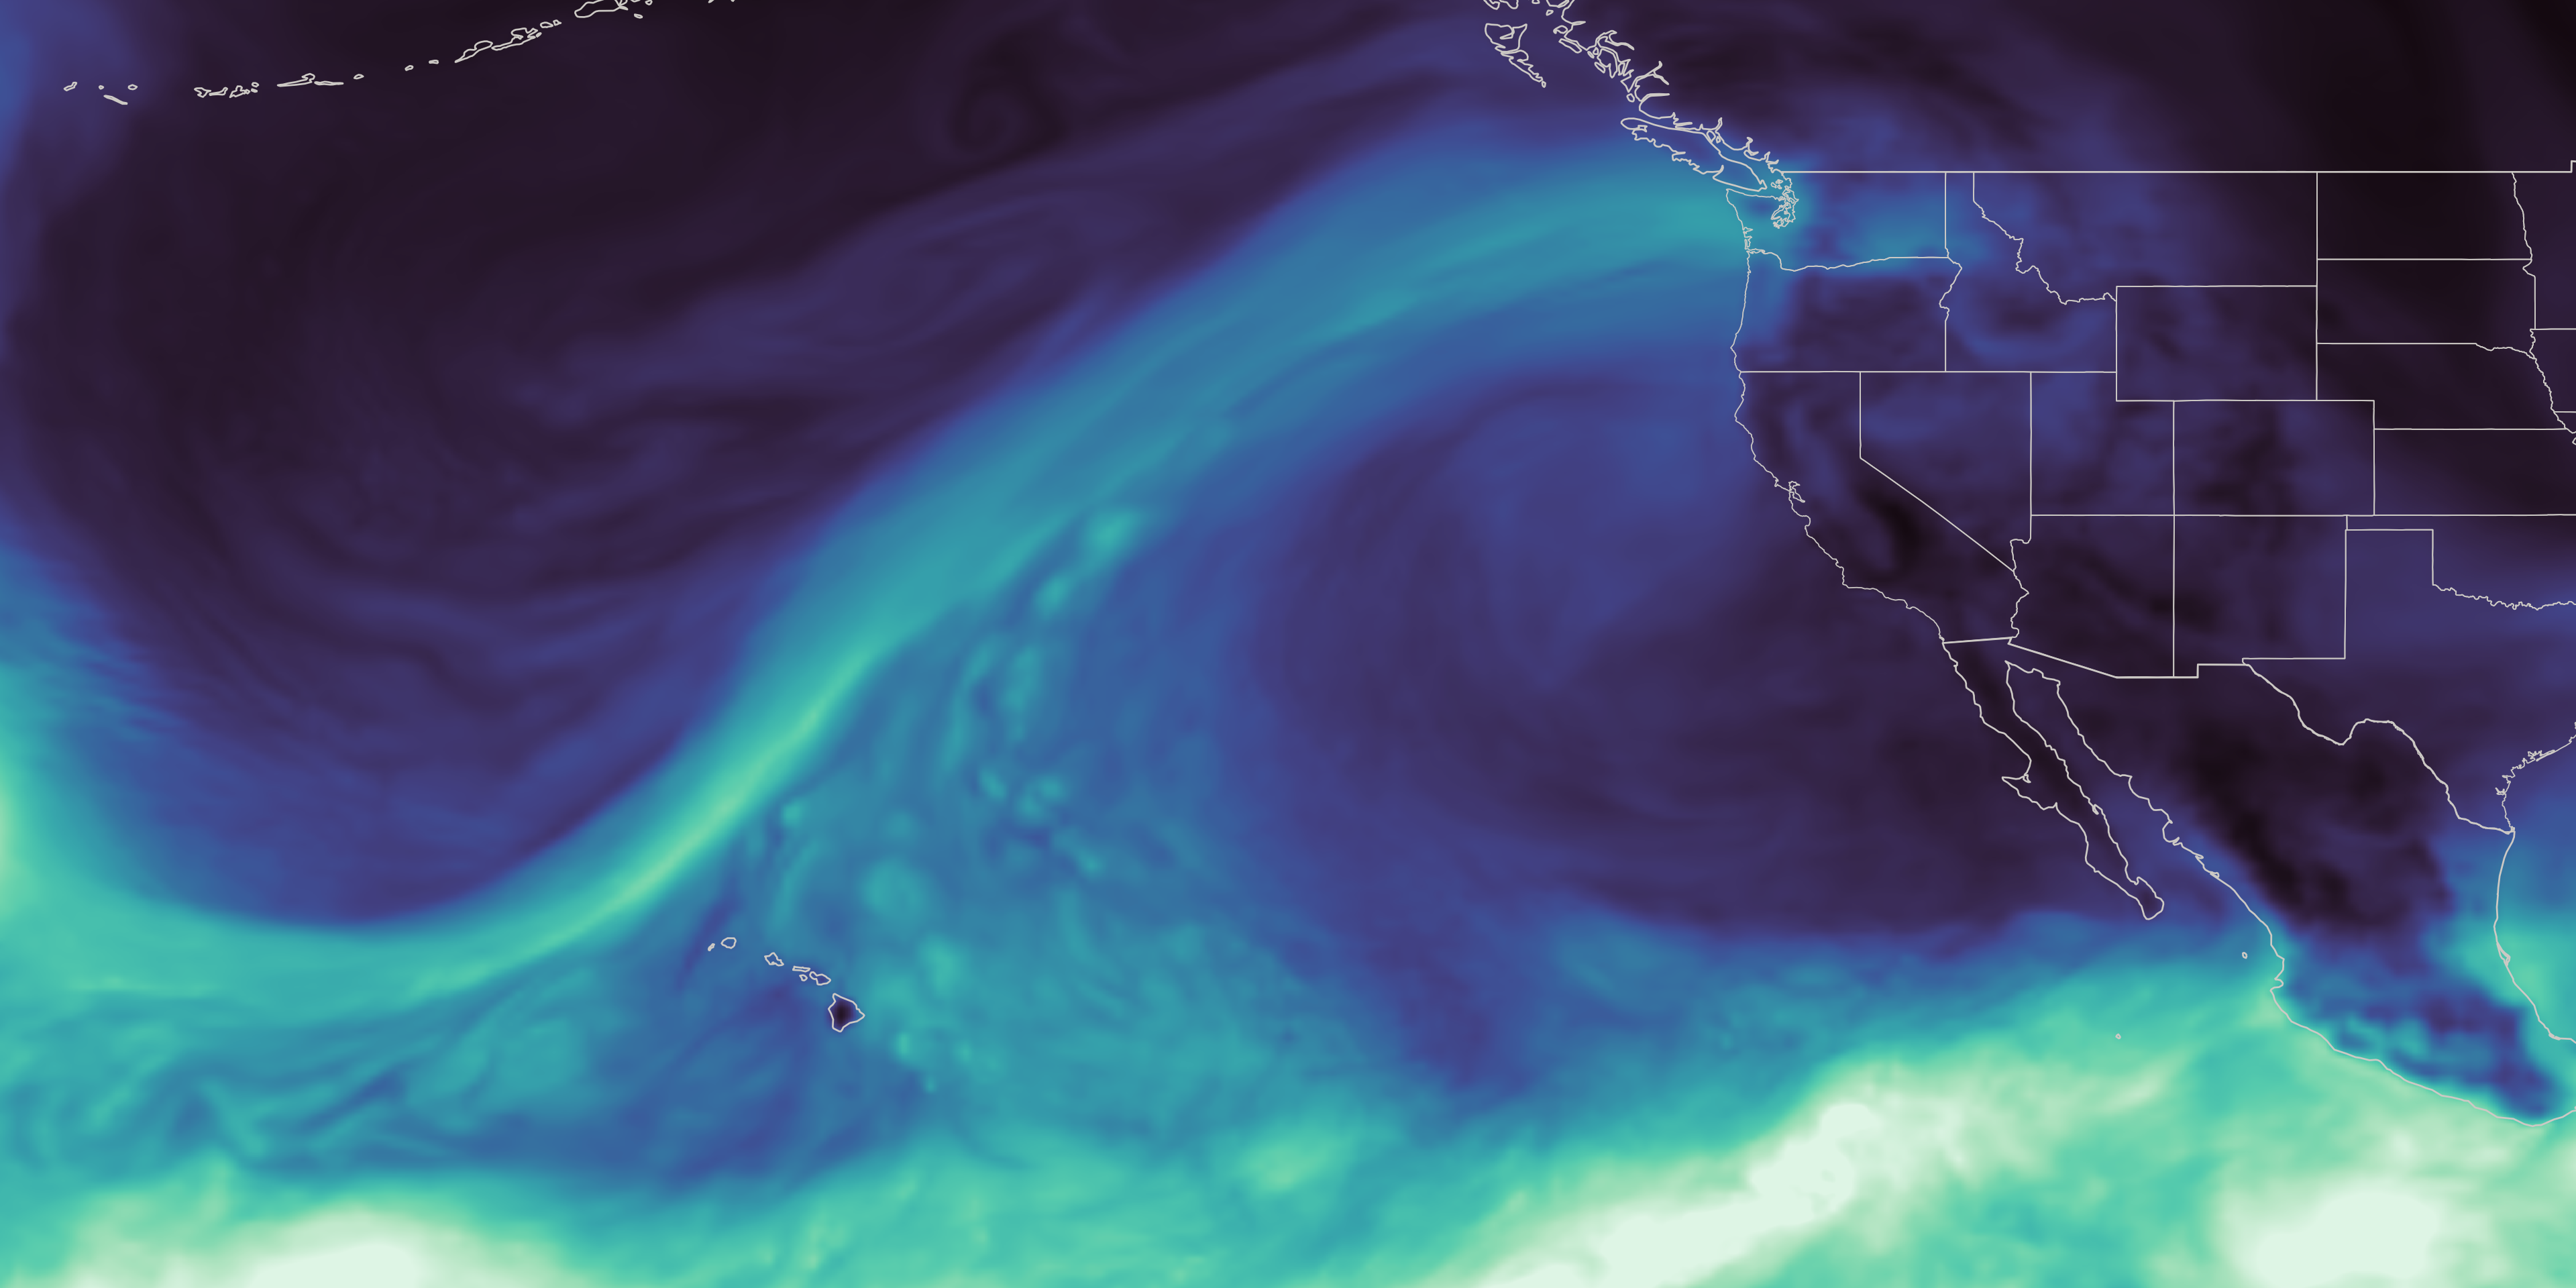
This map, derived from NASA’s GEOS (Goddard Earth Observing System), shows an atmospheric river reaching Washington state in December 2025, during a winter marked by extreme rainfall and too little mountain snow.
NASA’s Scientific Visualization Studio

As the effects of the 2026 snow drought in the western United States carry into summer, NASA Earth data is feeding machine-learning forecasts that inform decisions about water, power, and public safety in Washington state.  

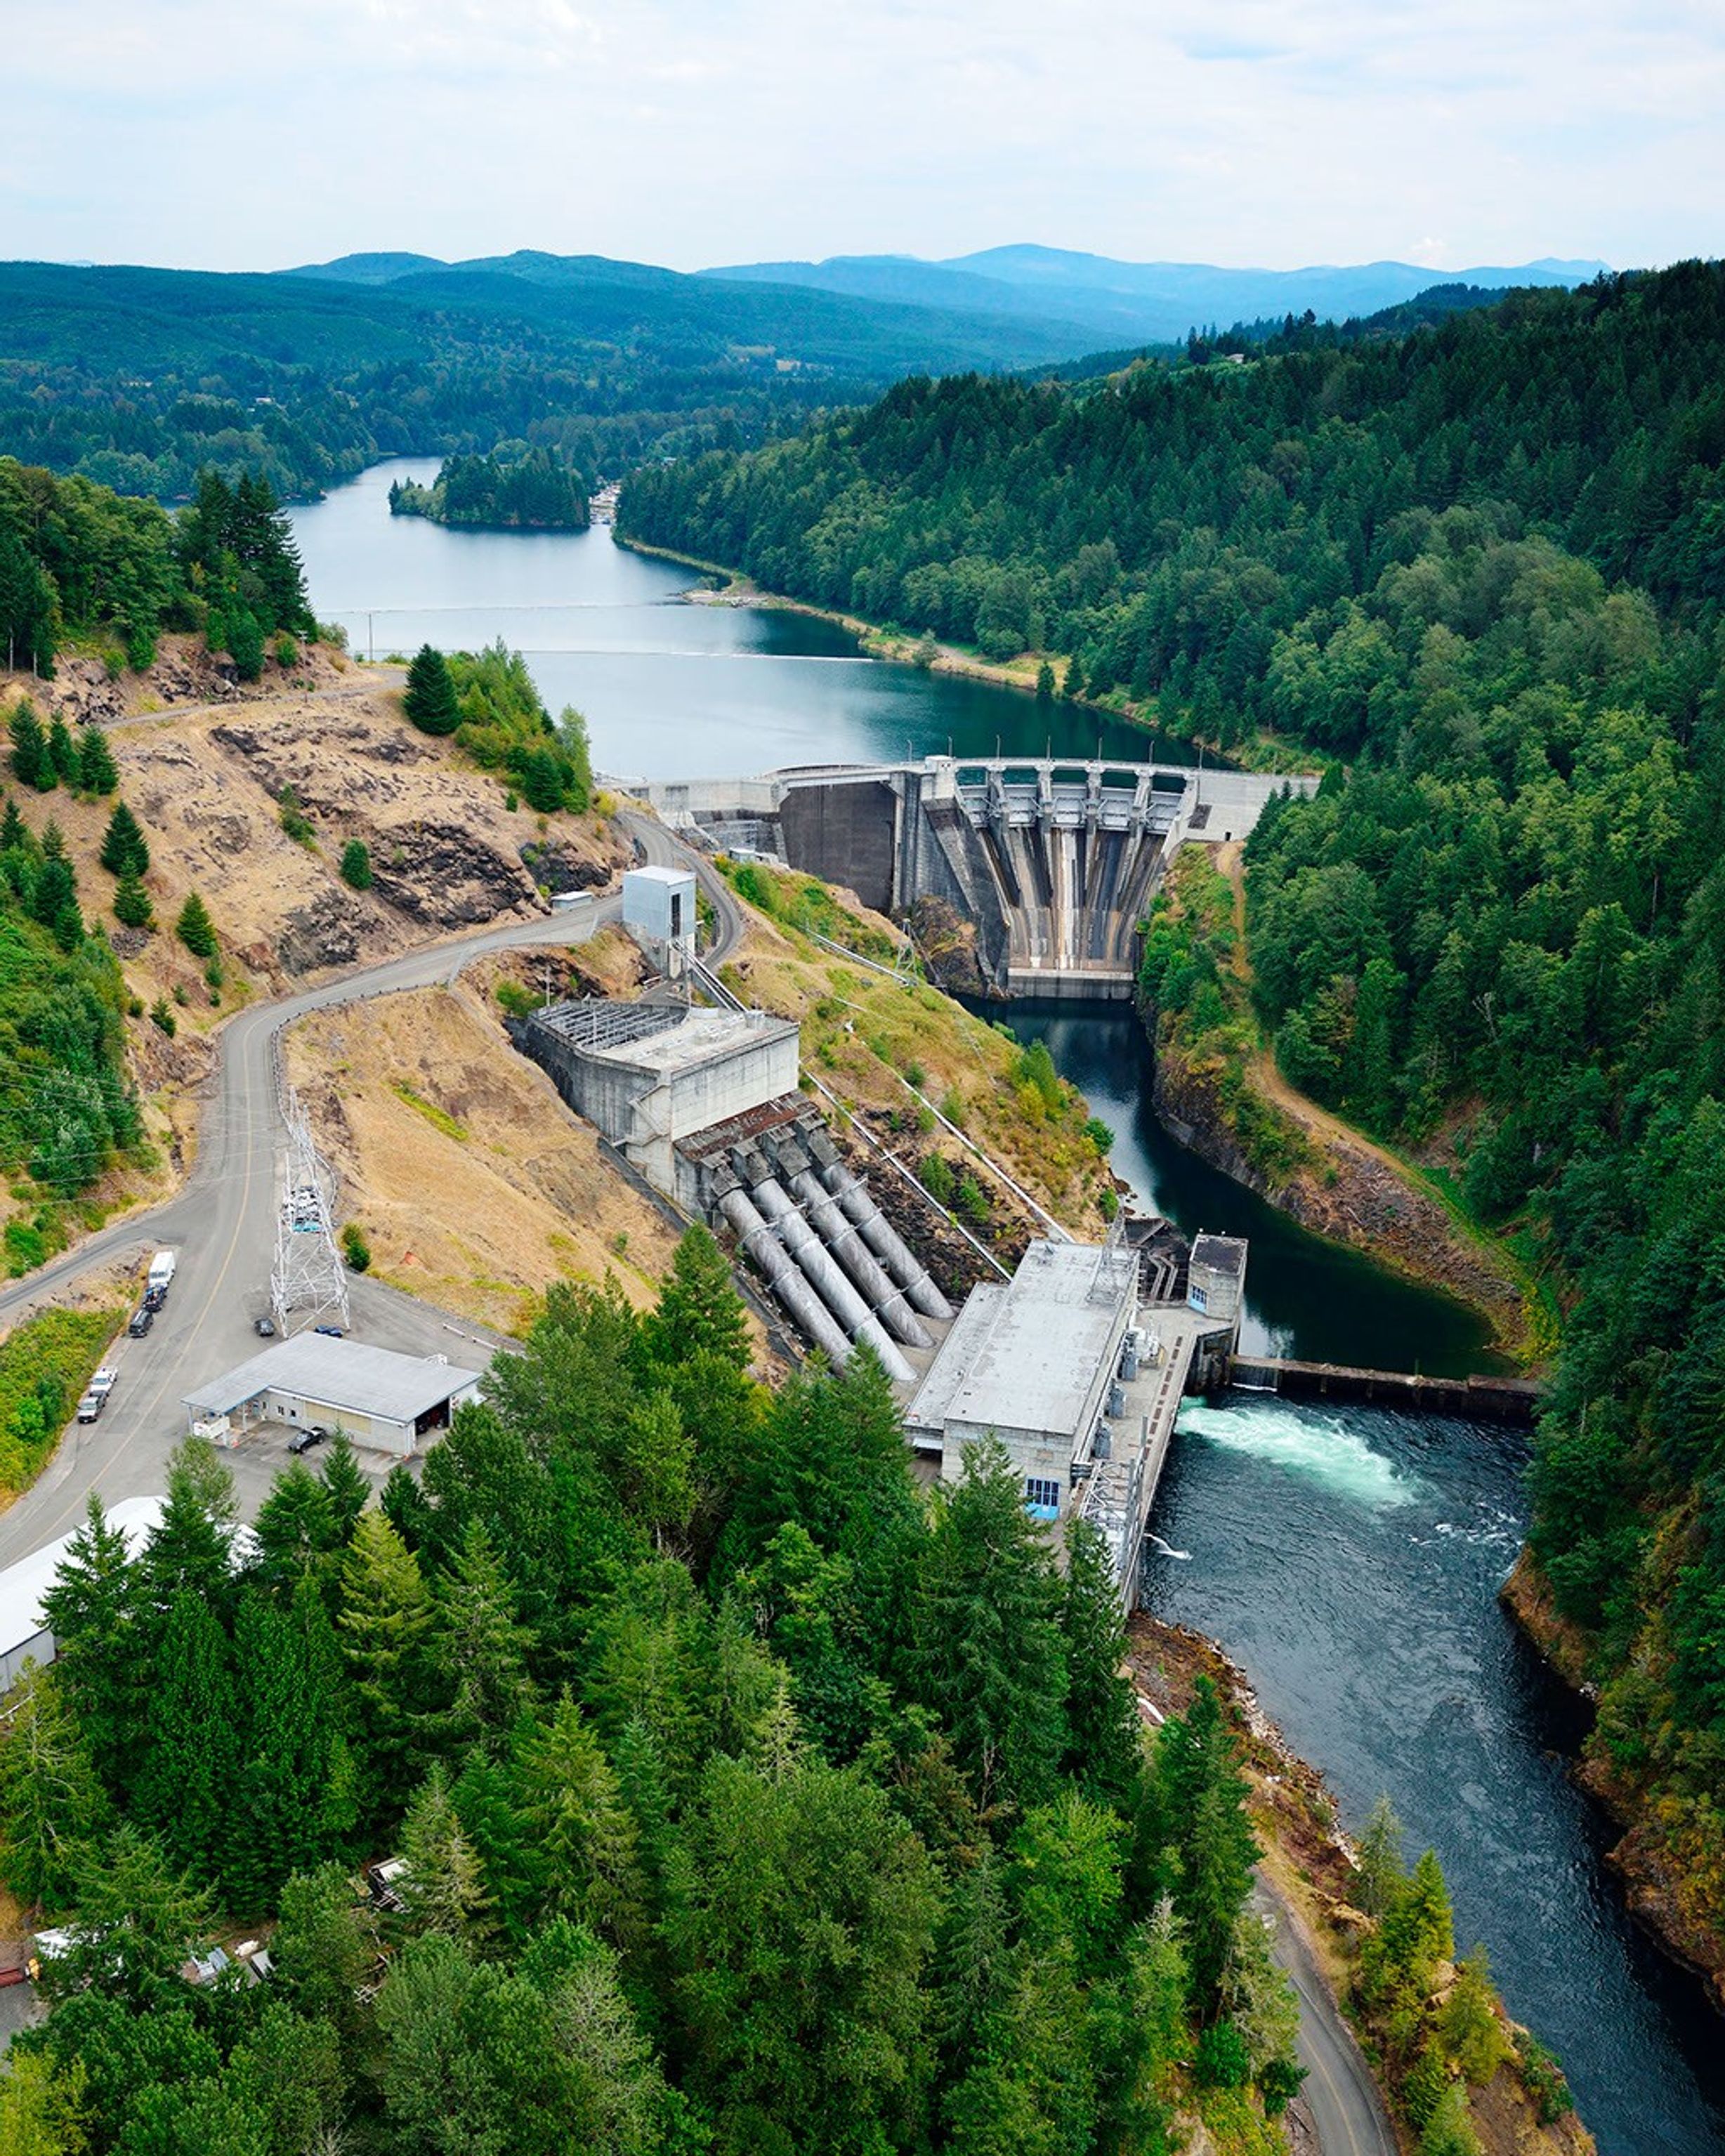
Tacoma Power, a Washington public utility, is using a U.S. technology company’s river-flow forecasts during a year of water extremes on the Cowlitz River. The utility’s largest hydroelectric project uses water stored behind Mayfield and Mossyrock dams to generate enough electricity to serve more than 151,000 homes each year.

Upstream Tech’s HydroForecast combines weather forecasts and river measurements with NASA-produced satellite data on snow cover and vegetation conditions to predict river flow from hours to days ahead. Updated every two hours, the forecasts are used by reservoir managers, hydropower producers, water utilities, and government agencies to prepare for storms, plan reservoir water releases, and navigate dry periods.

“Part of NASA’s mission is to make the view from space useful on the ground,” said Erin Urquhart, manager for NASA’s Water Resources program at the agency’s headquarters in Washington, D.C. “When an American company incorporates NASA’s freely available data into forecasts that help water managers prepare for floods, generate power, and steward water supplies, that’s NASA delivering practical value to the nation.”

Year of water extremes

During the winter of 2025-26, unusual warmth meant a larger share of precipitation fell as rain instead of snow across much of the West, while below-normal precipitation deepened deficits in some areas. January, February, and March each had the lowest Western snow cover for that month in the NASA MODIS (Moderate Resolution Imaging Spectroradiometer) satellite record since 2001.

On the Cowlitz, those conditions produced a season of extremes. In December 2025, a powerful atmospheric river brought a long, narrow band of Pacific moisture into the region, causing one of the largest one-day inflow surges ever recorded at Tacoma Power’s hydroelectric project. Across the season, that rain-heavy pattern sent water downstream quickly instead of building mountain snowpack that would melt and release water steadily into summer. Snowpack remained at just 20% to 50% of normal levels.

As winter became spring, the rain tapered off, and on April 8, Washington state placed every watershed, including the Cowlitz, under a drought emergency. From April through June, peak daily inflow into the project was among the lowest on record, leaving Tacoma Power with less incoming water to replenish its reservoirs ahead of summer demand, said Saul Villarreal, Tacoma Power’s senior hydro operations manager.

Tacoma Power’s Mayfield Dam and powerhouse sit on the Cowlitz River in southwest Washington, where forecasts using NASA data support reservoir operations and hydropower generation.
Tacoma Power, used with permission

Turning satellite data into river forecasts

NASA turns observations collected by the VIIRS (Visible Infrared Imaging Radiometer Suite) instrument on the Suomi-NPP (Suomi National Polar-orbiting Partnership) satellite into data products that provide information about snow cover and vegetation greenness across entire watersheds, including where ground monitors are sparse.

To train HydroForecast, Upstream Tech collects and archives years of those NASA products alongside weather forecast data and actual river-flow measurements. Using records from hundreds of watersheds, the models learn common patterns in how water moves through the landscape and apply them in new locations.

Tests across multiple basins found that including snow and vegetation observations increased forecast skill, said Dr. Laura Read, director of technical and federal partnerships for HydroForecast at Upstream Tech. “NASA’s data gives us the reliability, global coverage, and consistency we need,” said Read. “Our short-term models run every two hours, so those inputs have to show up when we need them. Though we have stopgaps in place, any interruption to our operational pipeline is a huge deal.”

Tacoma Power uses HydroForecast alongside stream gauges, snow stations, and operator judgment. During the December storm, the NASA-informed, short-term forecast helped the utility anticipate how much water would reach the project and prepare for dynamic river conditions, while meeting operating requirements and keeping public safety at the forefront, Villarreal said.

NASA’s GEOS (Goddard Earth Observing System) maps an atmospheric river, a ribbon of water vapor, before Washington’s January-April 2026 snow cover is compared with a historical median.
NASA’s Scientific Visualization Studio

As spring approached, the operational challenge reversed. Tacoma Power used HydroForecast’s seasonal model to track the growing risk of weak runoff and began keeping its reservoirs higher than usual to preserve water for summer. That left less space to contain another large storm, so operators continued checking the short-term forecast “to play defense,” and remained ready to adjust operations if another atmospheric river developed.

“The earlier we understand how conditions might change, the more effective planning we can do to manage our reservoir and balance the many demands of our system throughout the season,” said Villarreal.

Tacoma Power entered summer 2026 with reservoir levels near average despite the dry spring. The stored water supports reliable hydropower, required river flows to support fish and aquatic habitat, and public recreation. It also gives the utility more flexibility to meet electricity demand during heat waves or unexpected outages and, when possible, support the wider regional power system.

From forecasts to drought assessments

Tacoma Public Utilities’ Cowlitz Hydro Project is just one example of NASA science supporting water decisions across the West.

NASA also has partnered with the U.S. Department of Agriculture’s Natural Resources Conservation Service to bring satellite-based snow and groundwater information into machine-learning water-supply forecasts.

The National Oceanic and Atmospheric Administration’s Colorado Basin River Forecast Center uses MODIS and VIIRS data to adjust snowmelt rates in its model. The Bureau of Reclamation uses NASA and NASA-derived snow data, alongside other sources, for reservoir operations in California’s San Joaquin Basin.

NASA data and research have long informed the U.S. Drought Monitor, the weekly assessment used by farmers, water managers, and public agencies. NASA became a formal partner in 2026, expanding its role from providing information to helping produce the assessment. The agency took its first turn authoring the Drought Monitor during the week of Aug. 17.

About the Author

Emily DeMarco

Emily DeMarco

Writer/Editor (IV), Earth Science Division

Emily is a science writer and editor with NASA’s Earth Science Division, with more than 10 years of experience in science journalism and communication. A former deputy news editor at the magazine Science News, she holds a master’s in environmental science and management from UC Santa Barbara’s Bren School, where she specialized in water resources management and science communication.

Source: science.nasa.gov

Posted on Leave a comment

SmallSat 2026

SmallSat 2026

Join NASA in the Exhibit Hall (Booth # 635, 835, 641, and 940) for Storytelling by NASA experts. Full Agenda below.

MONDAY, AUGUST 24, 9:00 – 10:00 AM

Welcome Jose Nunez
BryceTech’s Smallsats by the Numbers: 2026 Fletcher Franklin
Supply Chain Observations Bruce Yost

Technology Shortfall 
Rudy de Rosee
SPARCS Camera and Early Science Observations Kaitlyn Ashcroft
JPL: Skyfall Tim Canham
SWIFT LINK Reboost Bo Naasz
Flight Opportunities – Hosted Orbital Ecosystem – Fly Foundational Robos – Space Roboticist Challenge Anh Nguyen
From Rideshare to Dedicated Launches: SmallSat Options with NASA LSP Caley Burke
You Bring the Mission, We’ll Bring the Lab: Partnering with MSFC Rush Elkins
NASA Ames Mission Design Center: Imagining the Next Generation of Spaceflight Missions Matthew Napoli
Engineering Challenges and Best Practices from a Stellar Launch Cycle Brad Williams
HIAD Payload Return Solution for SmallSats Joe Del Corso

3:25 – 4:10 PM

Moderating Bruce Yost
RTMD NASA Greg Stover
SMD HPD ADF Asal Naseri
HSMD CSLI/CLPS/ Commercial Access to Space (CAtS) Pete Wilczynski
CARA: Conjunction Assessment Best Practices Lauri Newman

TUESDAY, AUGUST 25, 9:45 – 10:45 AM

Moderating Cari Reinert
SMD Panelist 1 – Solicitations Aly Mendoza-Hill
STMD Panelist CATALYST – I-Corps Maggie Yancey
SBIR / STTR- Launchpad for Innovation Ryszard Pisarski
Agency level Tech Transfer Jose Nunez

3:15 – 4:15 PM

Moderating Aly Mendoza-Hill
SMD – APD Pioneers Pablo Saz Parkinson
SMD – Science as a Service: What SmallSat Providers Need to Know Beth Weinstein
SMD – HPD Asal Naseri
ESCAPADE (HPD) Innovating Methods for Exploration Skyler Kleinschmidt

WEDNESDAY, AUGUST 26, 9:45 – 10:45 AM

Moderator, FO Panelist Danielle McCulloch
NASA CSLI, VADR Panelist Norman Phelps
CLPS Panelist Angela Melito
Rideshare Panelist Aly Mendoza-hill
SLS David Hitt

3:15 – 4:15 PM

Welcome / Close out Presentor/Moderator Sam Pedrotty
JPL Mission INCUS Benjamin (Benji) Donitz
SMD – Biological & Physical Sciences Payload Concepts for Future SmallSat Missions Matthew Lera
SMD APD – SWIFT Reboost highlight David Morris
SMD ESD – Mission Highlight Sachidananda Babu
SMD HPD – TRACERS Mission Highlight Skyler Kleinschmidt
SunRISE (SMD HPD) – Maximizing Science Uptime Across the Constellation Carson Schubert
STMD USTP Overview Mike Gaunce
STMD Mission CAPSTONE 02 Sam Phan
STMD R5 Spacecraft Series Sam Pedrotty
STMD GPDM Nehemiah Williams
STMD Mission DiskSat Roger Hunter

Source: science.nasa.gov

Posted on Leave a comment

Europe’s Scorching Summer

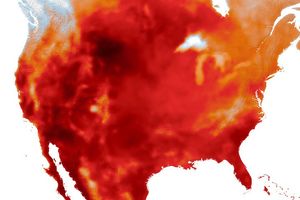
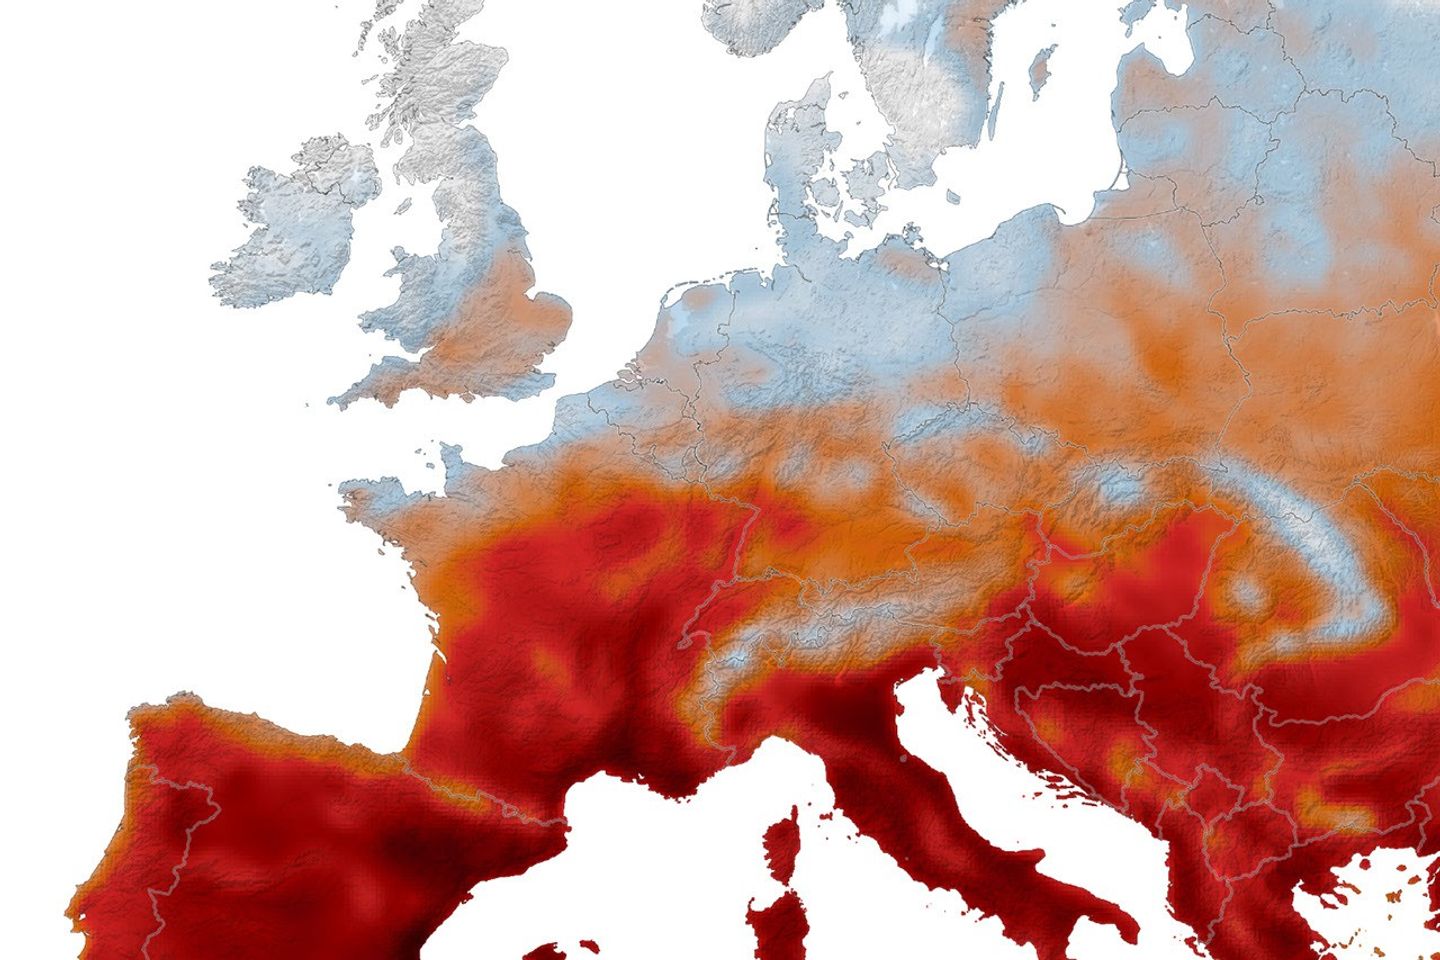
Output from NASA’s GEOS (Goddard Earth Observing System) global model shows daily maximum surface air temperature across Western Europe from May 1 to August 19, 2026. The darkest red areas indicate temperatures that met or exceeded 40°C (104°F).
NASA Earth Observatory/Lauren Dauphin

Western Europe got its first hint of an unusual summer in May 2026, when a heat dome produced exceptional temperatures that shattered records in several countries. Remarkable as it was, that early heat wave turned out to be only the opening salvo.

By mid-August, Europeans were sweating through their fifth heat wave of the season, with the latest onslaught pushing temperatures well above 40 degrees Celsius (104 degrees Fahrenheit) across a broad area. During these bouts of extreme weather, high temperatures were often unrelenting, persisting for several days and sometimes weeks on end, and remaining overnight.

For a region accustomed to relatively mild summers, the heat upended everyday life. Hospitalizations and heat-related deaths spiked. Highways and train tracks buckled, forcing road closures and service disruptions. Large and destructive wildfires raged in areas where they were once rarely seen. The heat also worsened the severe drought that has gripped the region for months, contributing to record-low river water levels and disrupting water and power supplies, transportation routes, and agriculture.

The animation above shows the daily maximum surface air temperature across Western Europe from May 1 to August 19, 2026. It was produced by combining satellite observations with temperatures predicted by a version of NASA’s GEOS (Goddard Earth Observing System) global model, which uses mathematical equations to represent physical processes in the atmosphere. The darkest red areas indicate where temperatures met or exceeded 40°C.

The heat broke records at a furious pace, often by wide margins. According to the UK Met Office, temperatures soared as high as 35.1°C (95.2°F) in London on May 26, smashing the previous May record by 2.3°C (4.1°F). In June, Bordeaux, France, broke its maximum-temperature record on three consecutive days, hitting 42.5°C on June 24, Météo-France reported. Slovakia, meanwhile, set new national records for both daytime and nighttime highs in August. Combined June and July temperatures in Western Europe were the highest on record, according to Europe’s Copernicus climate monitoring service.

In Europe, extreme temperatures collided with several vulnerabilities, including limited access to air conditioning, high nighttime temperatures, and a lack of green space in some cities. The circumstances triggered not just discomfort but heat exhaustion and heatstroke in some cases. Preliminary reports suggest that heat may have been associated with 10,000 excess deaths, including thousands of people in the UK, France, Germany, and Belgium.

“Air conditioning is an especially critical issue in Europe in the short term,” said Anamika Shreevastava, a researcher at New York University who studied urban heat islands as a postdoc at NASA’s Jet Propulsion Laboratory. One of her goals was to produce thermal maps based on NASA data from missions like ECOSTRESS that city planners could use to make cities more resilient to heat waves.

International Energy Agency data show that 23 percent of homes in Europe have air conditioning, compared to 90 percent of homes in the United States. That difference contributes to the much higher death rates that researchers have documented in European cities during heat waves than in comparable American cities. “Longer term, cities can also plant trees, expand parks, use reflective roof paint, and transition to building materials less likely to retain heat,” Shreevastava said.

An analysis from the World Health Organization indicates that heat stress is the world’s leading cause of weather-related deaths, noting it exacerbates underlying illnesses, including cardiovascular disease, diabetes, mental health conditions, and asthma. Researchers have calculated that roughly 489,000 heat-related deaths occur each year, with 45 percent of the deaths in Asia and 36 percent in Europe.

“For older adults with physical health problems, temperatures as low as 26.7°C (80°F) can pose significant danger,” said Deborah Carr, a Boston University sociologist who specializes in the study of aging. “Nighttime heat is especially harmful for older adults whose homes lack air conditioning.”

Carr is part of a research team that used demographic data, along with temperature and climate data archived by NASA, to identify which parts of the world are at the greatest risk of current and future heat exposure. Southern Europe was among the areas facing growing heat exposure and an aging population, the researchers found.

Other research, published in Lancet Planetary Health in August 2026, underscores the importance of demographics in assessing the risks posed by heat. This study, led by Stanford researcher Qinqin Kong, mapped where increasing heat is likely to lead to intolerable conditions in the coming decades for young, middle-aged, and older adults, concluding that safe thresholds will be breached often and widely, with risks falling disproportionately on older people.

“The human body can tolerate only a limited range of ambient heat,” said Kong, a recipient of a NASA Earth and Space Science and Technology award. “Understanding where, when, and to what extent these limits are exceeded is critical.”

With intolerable levels of heat expected to affect more people across larger regions and for longer periods than previously thought, Kong and his colleagues hope that their findings will inform targeted heat action plans, emergency preparedness, and health system planning.

NASA Earth Observatory image by Lauren Dauphin, using GEOS-FP data from the Global Modeling and Assimilation Office at NASA GSFC. Story by Adam Voiland.

References & Resources

You may also be interested in:

Stay up-to-date with the latest content from NASA as we explore the universe and discover more about our home planet.

Heat Dome Broils the Western U.S.

4 min read

A ridge of high pressure fueled record-breaking temperatures in Montana, Utah, and Wyoming on July 12, 2026.

Article

Sensing the Poles’ Hidden Heat

3 min read

New animations from NASA’s PREFIRE mission reveal two years of seasonal temperature swings at the Arctic and Antarctic.

Article

El Niño Is Underway

4 min read

Satellite observations of sea surface height indicated that the 2026 event continued to strengthen in early June.

Article

Source: science.nasa.gov

Posted on Leave a comment

What Lake Bonneville Left Behind

Tan and white plains surround a dark mountainous ridge in a three-dimensional image of the Silver Island Mountains.
The rugged terrain of the Silver Island Mountains and Crater Island rises above the pale playa and bright salt flats of former Lake Bonneville. The image was acquired with the OLI (Operational Land Imager) on Landsat 8 on June 4, 2026, and overlaid on a digital elevation model.
NASA Earth Observatory/Michala Garrison

At its peak, ancient Lake Bonneville would have been a sight to behold. Nearly as large as Lake Michigan, the Ice Age lake spread across much of western Utah and parts of Nevada and Idaho. When it eventually receded, it left behind flat, bright playas and salt flats rich with minerals—a landscape that would later serve as the setting for feats of engineering and technological ingenuity, as well as epic tales of exploration and desperation.

Lake Bonneville began forming about 55,000 years ago during a cool, wet period, when volcanic eruptions in what’s now southeastern Idaho diverted the Bear River, causing water to gather in Gem Valley and other basins to the south. For tens of thousands of years, a natural dam at Red Rock Pass helped confine the lake.

Then, about 18,000 years ago, water breached that dam, unleashing a torrent that entered the Columbia River system. Over a six-week period, amid one of North America’s largest floods, lake levels plummeted by more than 350 feet (105 meters). As the climate warmed and dried in subsequent millennia, the lake shrank dramatically, leaving remnants that include today’s Great Salt Lake, Utah Lake, and Sevier Lake.

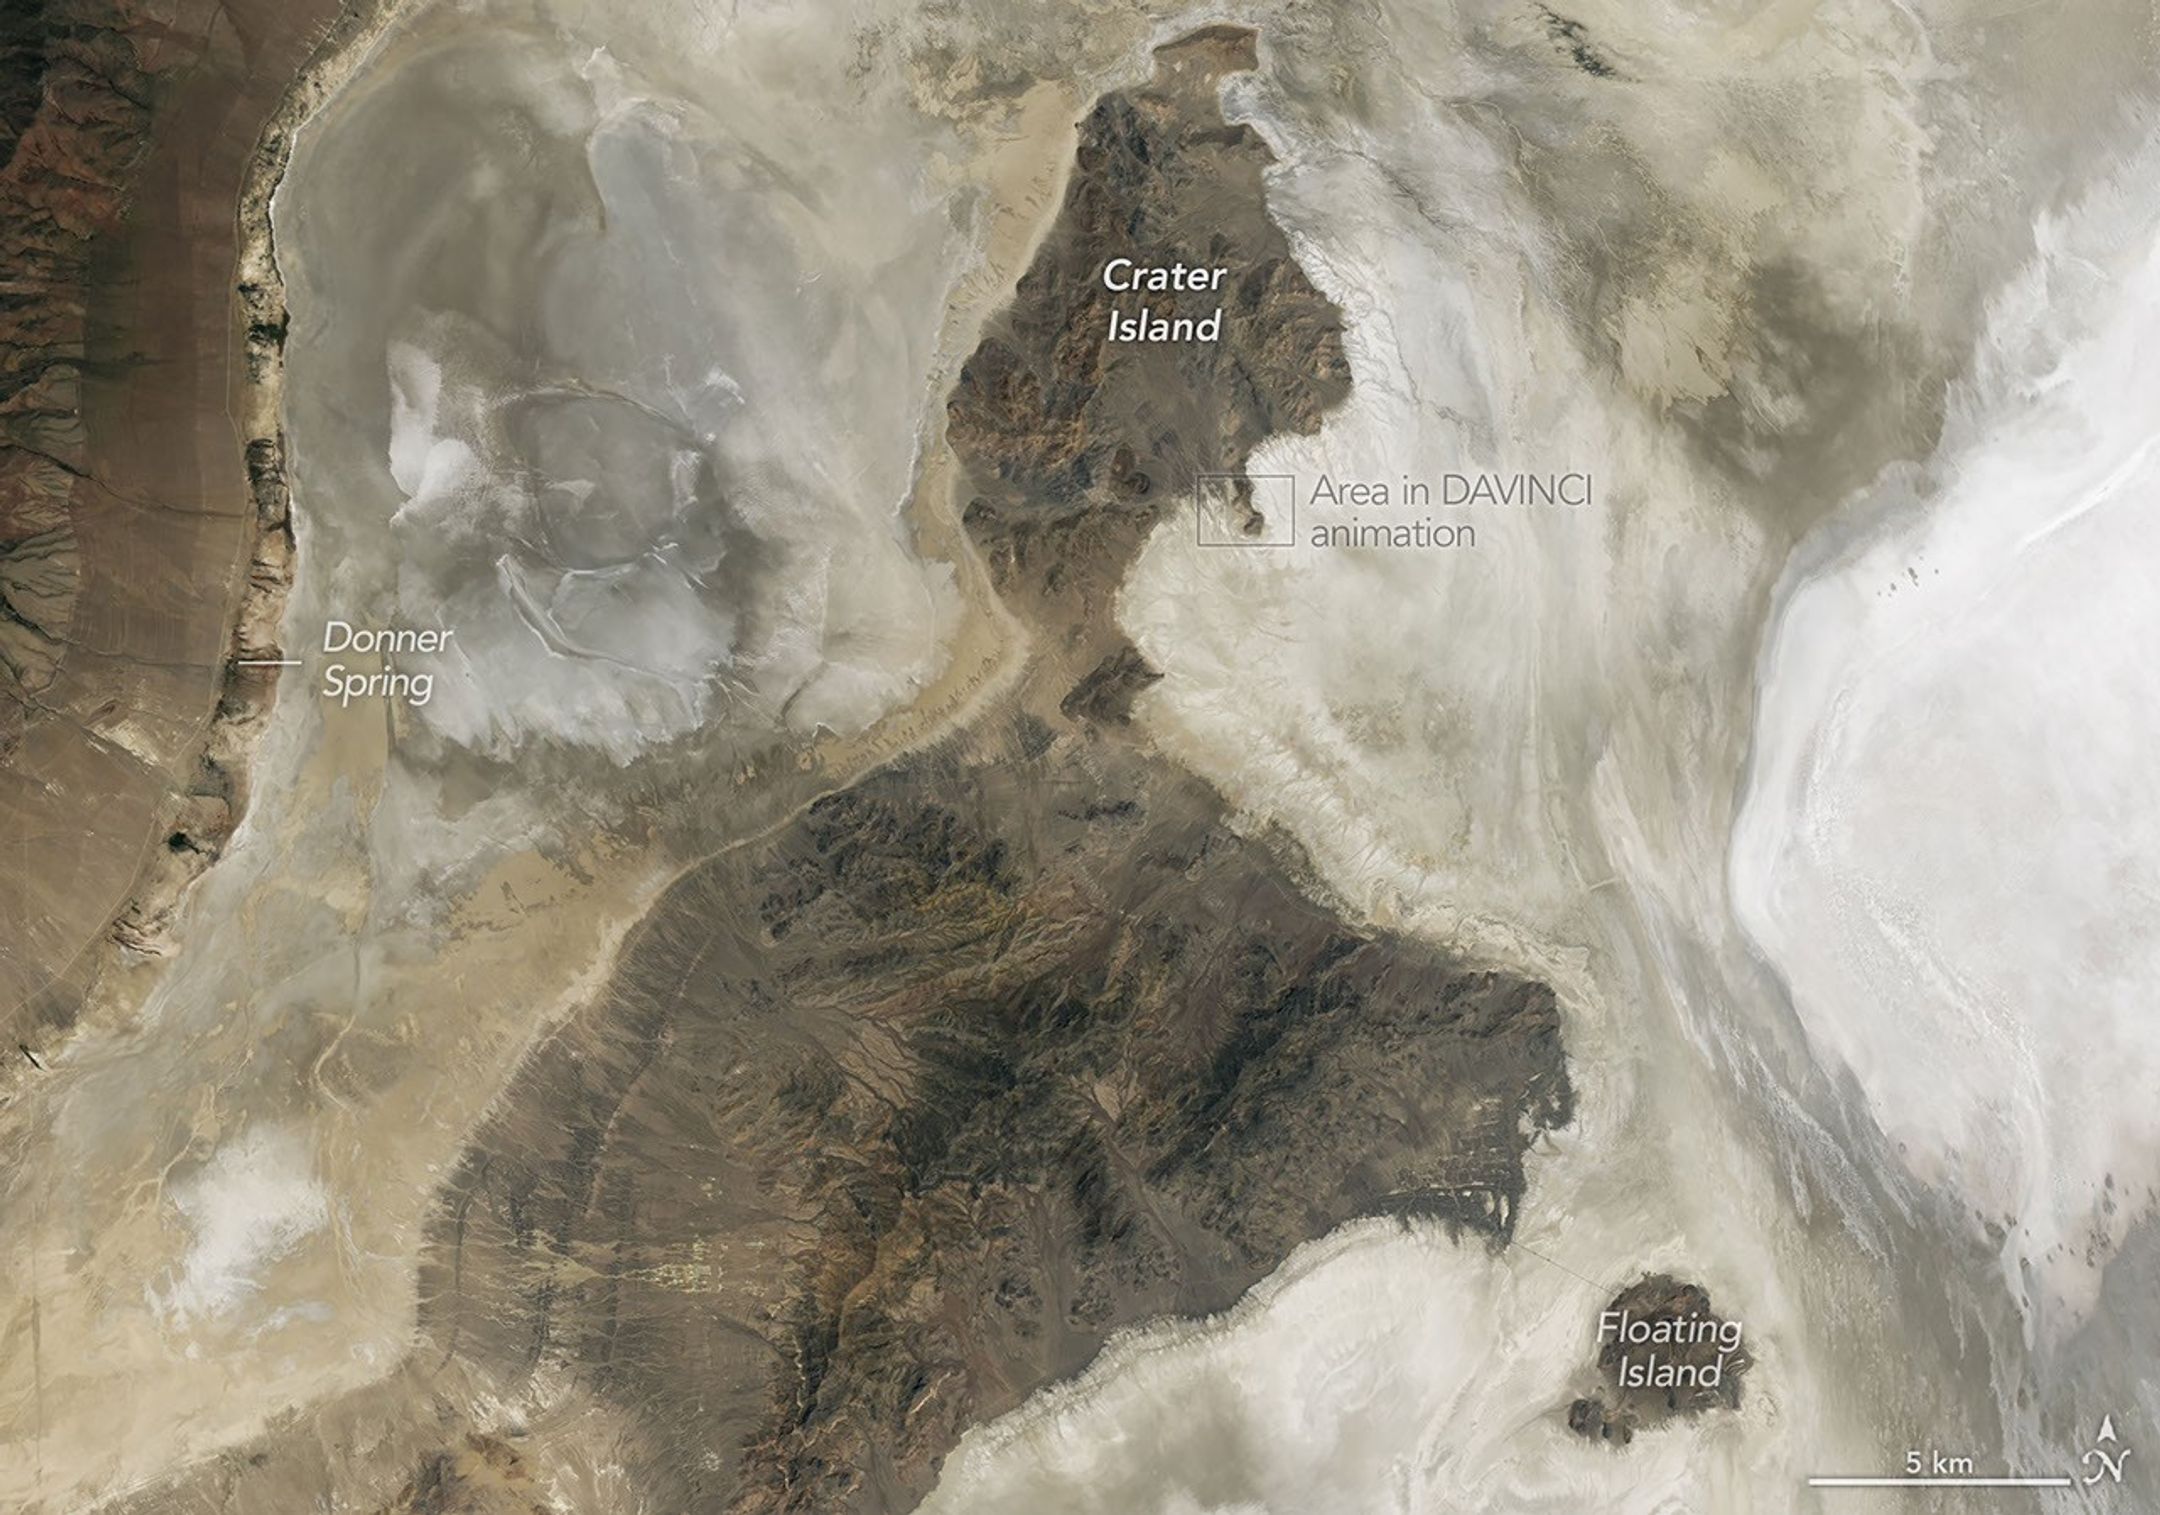
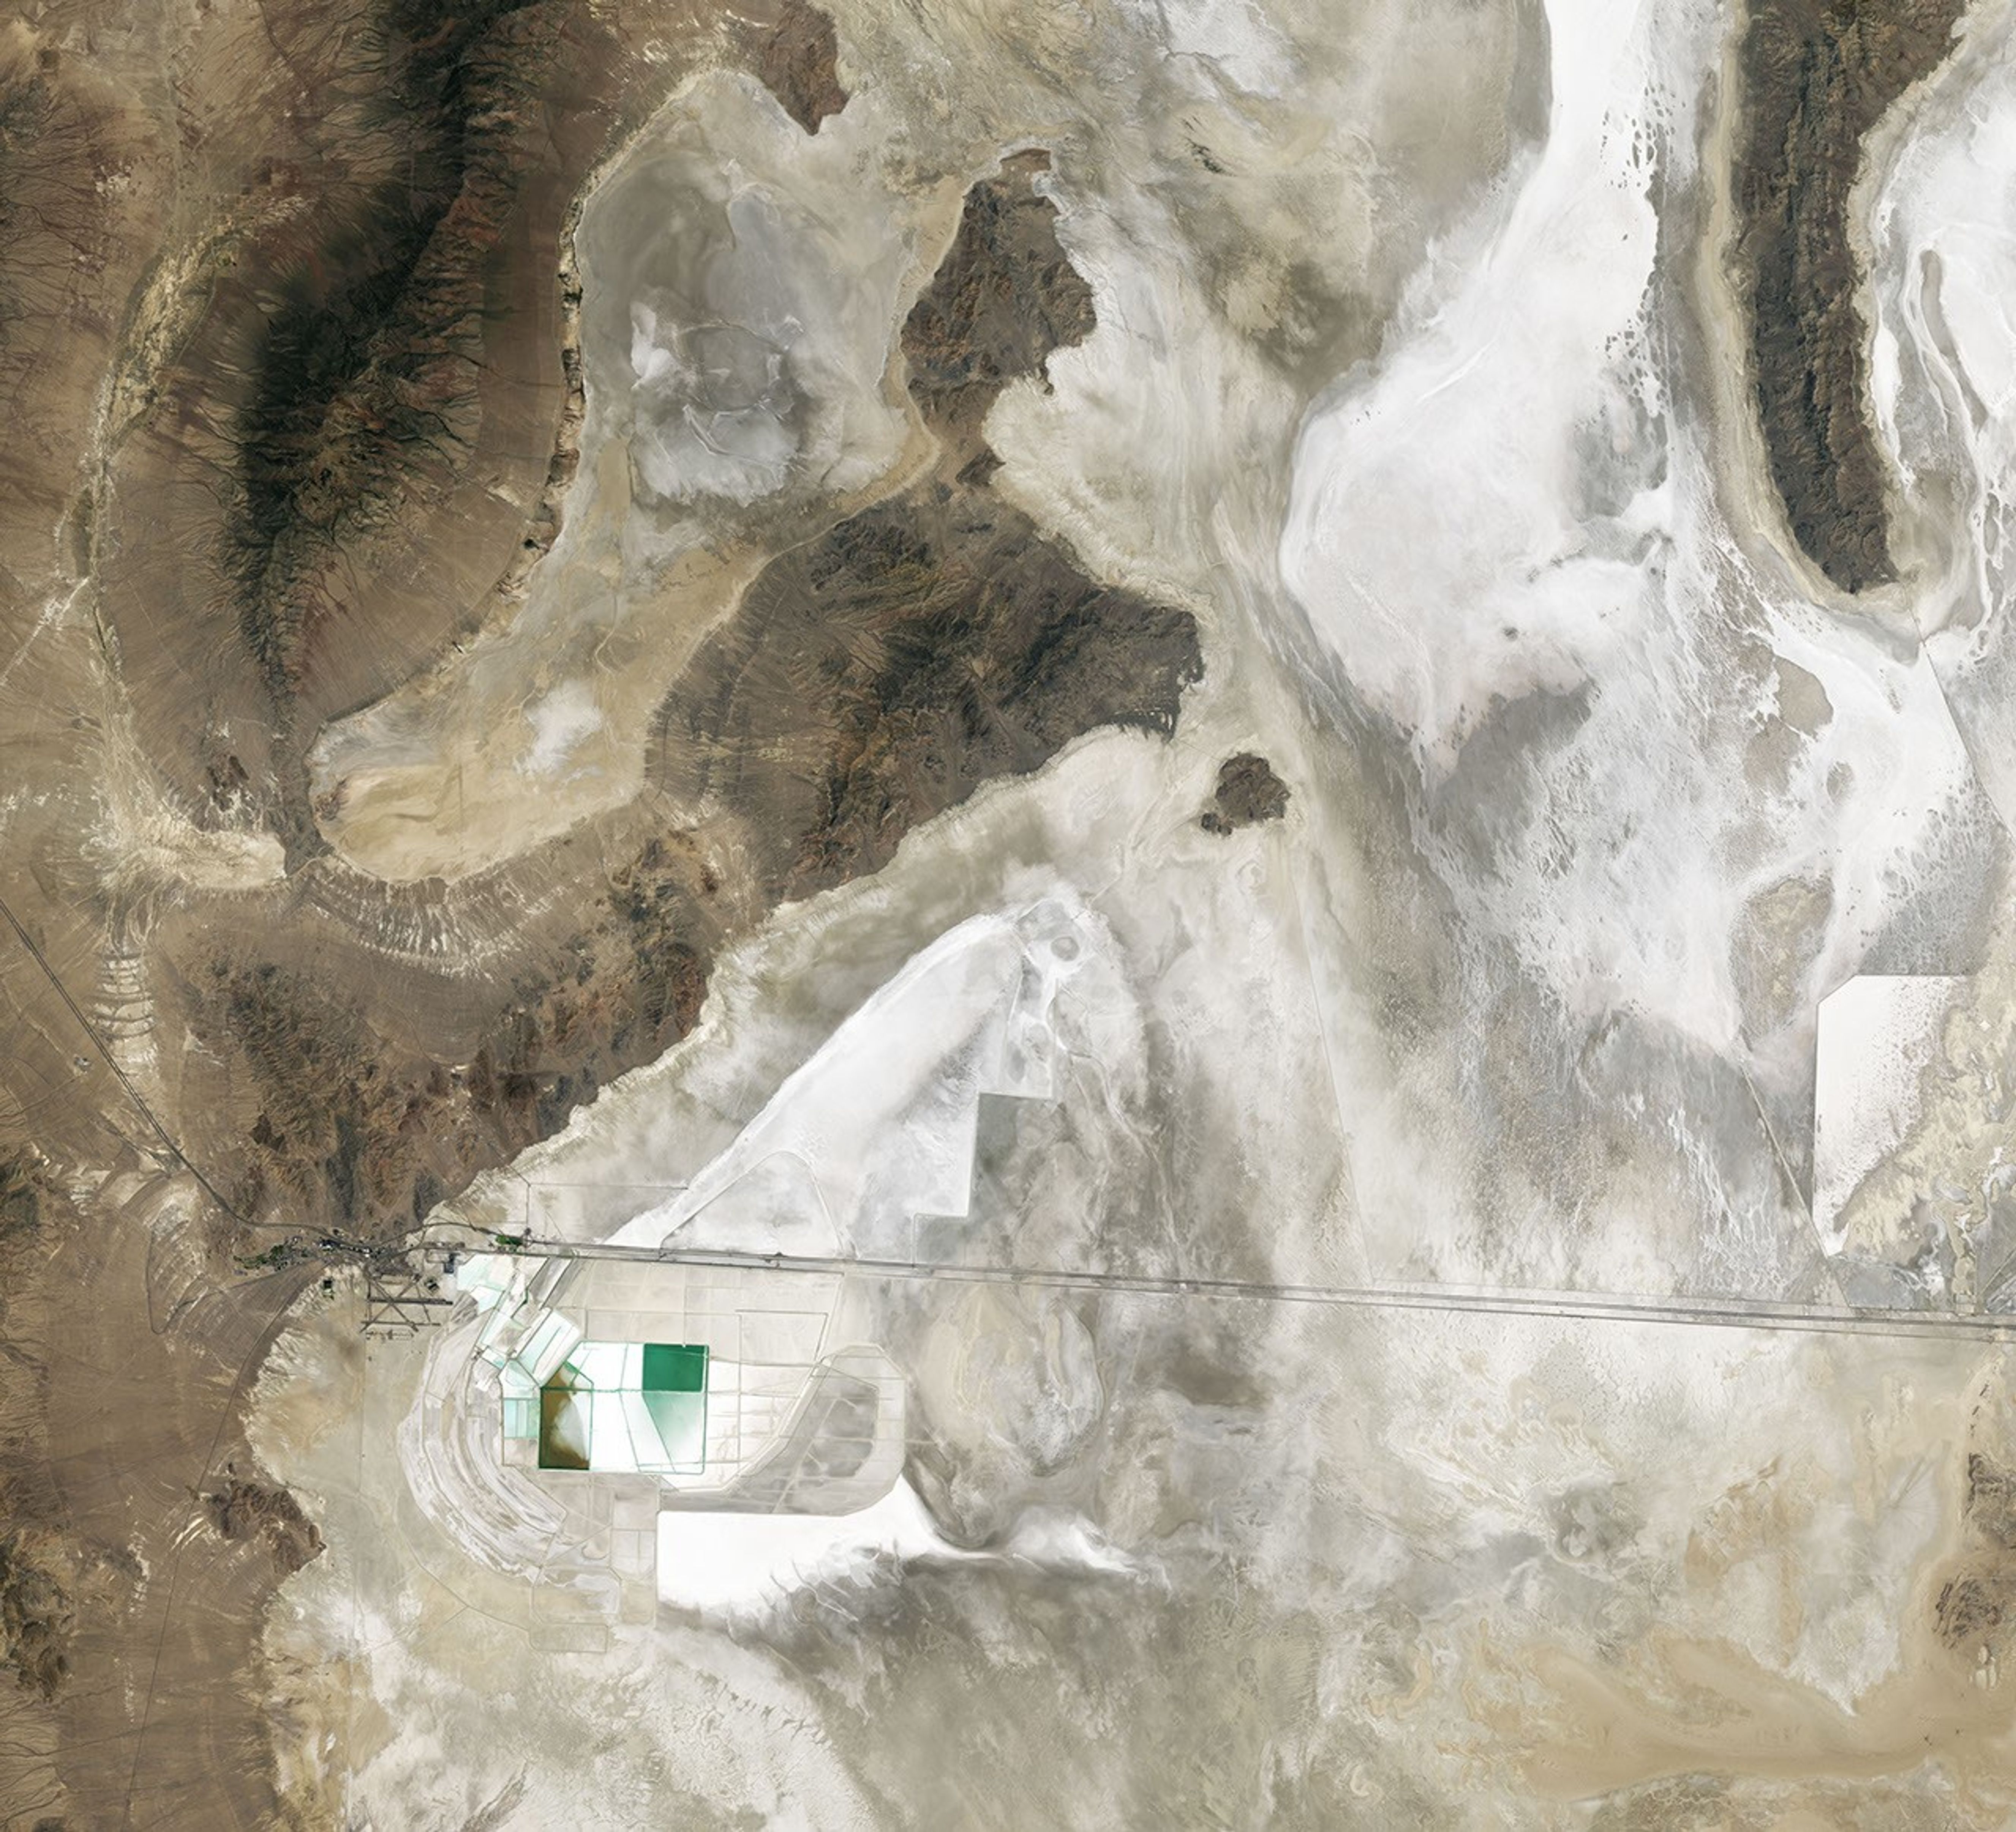
Lake Bonneville may be gone, but its imprint on the region’s landscape remains—even in satellite imagery. In this image (below) captured by the OLI (Operational Land Imager) on the NASA-USGS Landsat 8 satellite, bathtub-like rings and wave-cut terraces trace the position of former shorelines. The dried lakebed—where fine-grained clay, marl, and sandy sediment settled out of the water—appears pale in comparison to the darker, rockier, more vegetated surroundings.

A nadir view shows Crater Island—a dark, linear mountain ridge in the center of the image—flanked by flat tan and white landscapes.
NASA scientists analyzed the terrain in this part of Utah when testing technologies that will be used on NASA’s DAVINCI mission to Venus. This image was acquired with the OLI (Operational Land Imager) on Landsat 8 on June 4, 2026.
NASA Earth Observatory/Michala Garrison

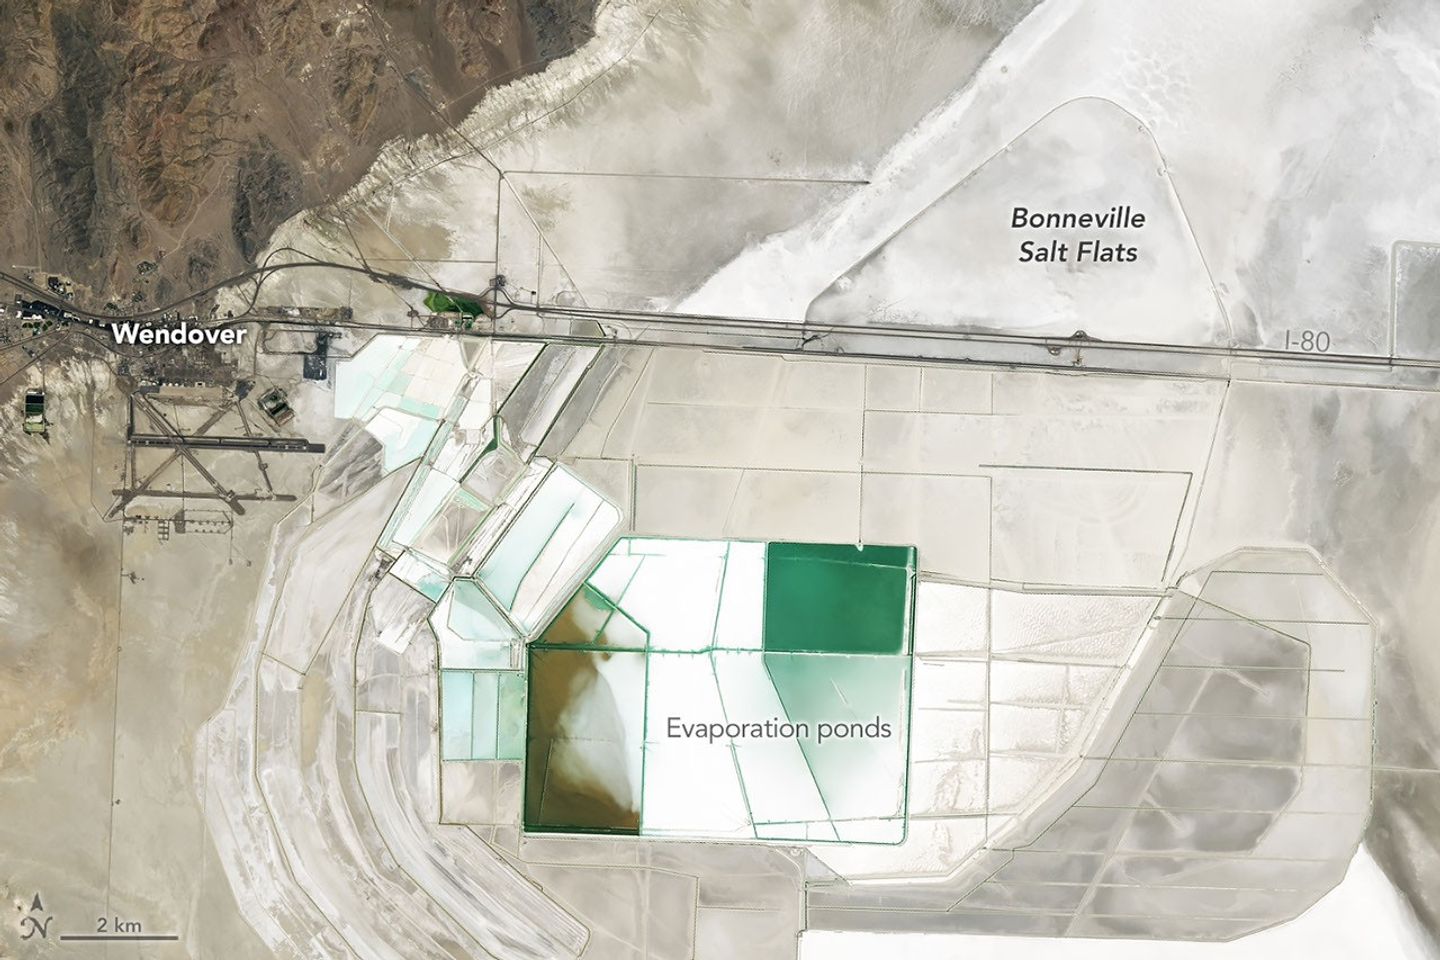
In deep parts of the basin, where runoff and groundwater still pool, bright deposits of evaporite minerals coat the land surfaces, forming salt flats. These remarkably flat surfaces are the product of water gradually evaporating and concentrating minerals to produce brines and hard mineral crusts, typically including halite and gypsum, along with potassium- and magnesium-bearing salts. Brines and deposits like these—particularly of potash, which is used as a fertilizer—have long made the playa a target for mining, as seen in the rectangular evaporation ponds above and below.

In contrast, the darker, more rugged terrain—including the Silver Island Mountains, the Newfoundland Mountains, and the Pilot Range—that rises above the playas is built from layers of erosion-resistant sedimentary and metasedimentary bedrock that is hundreds of millions of years old. These mountains also contain younger igneous and metamorphic rocks that formed when magma intruded into the ancient sedimentary sequence.

Crater Island, for instance, is composed of sedimentary rocks, including silica-rich sandstones and quartzites that formed as sands accumulated in a shallow ocean, as well as intrusions of quartz monzonite, granites, and other igneous rocks. Periods of crustal stretching later produced the fault-block mountains that define the landscape.

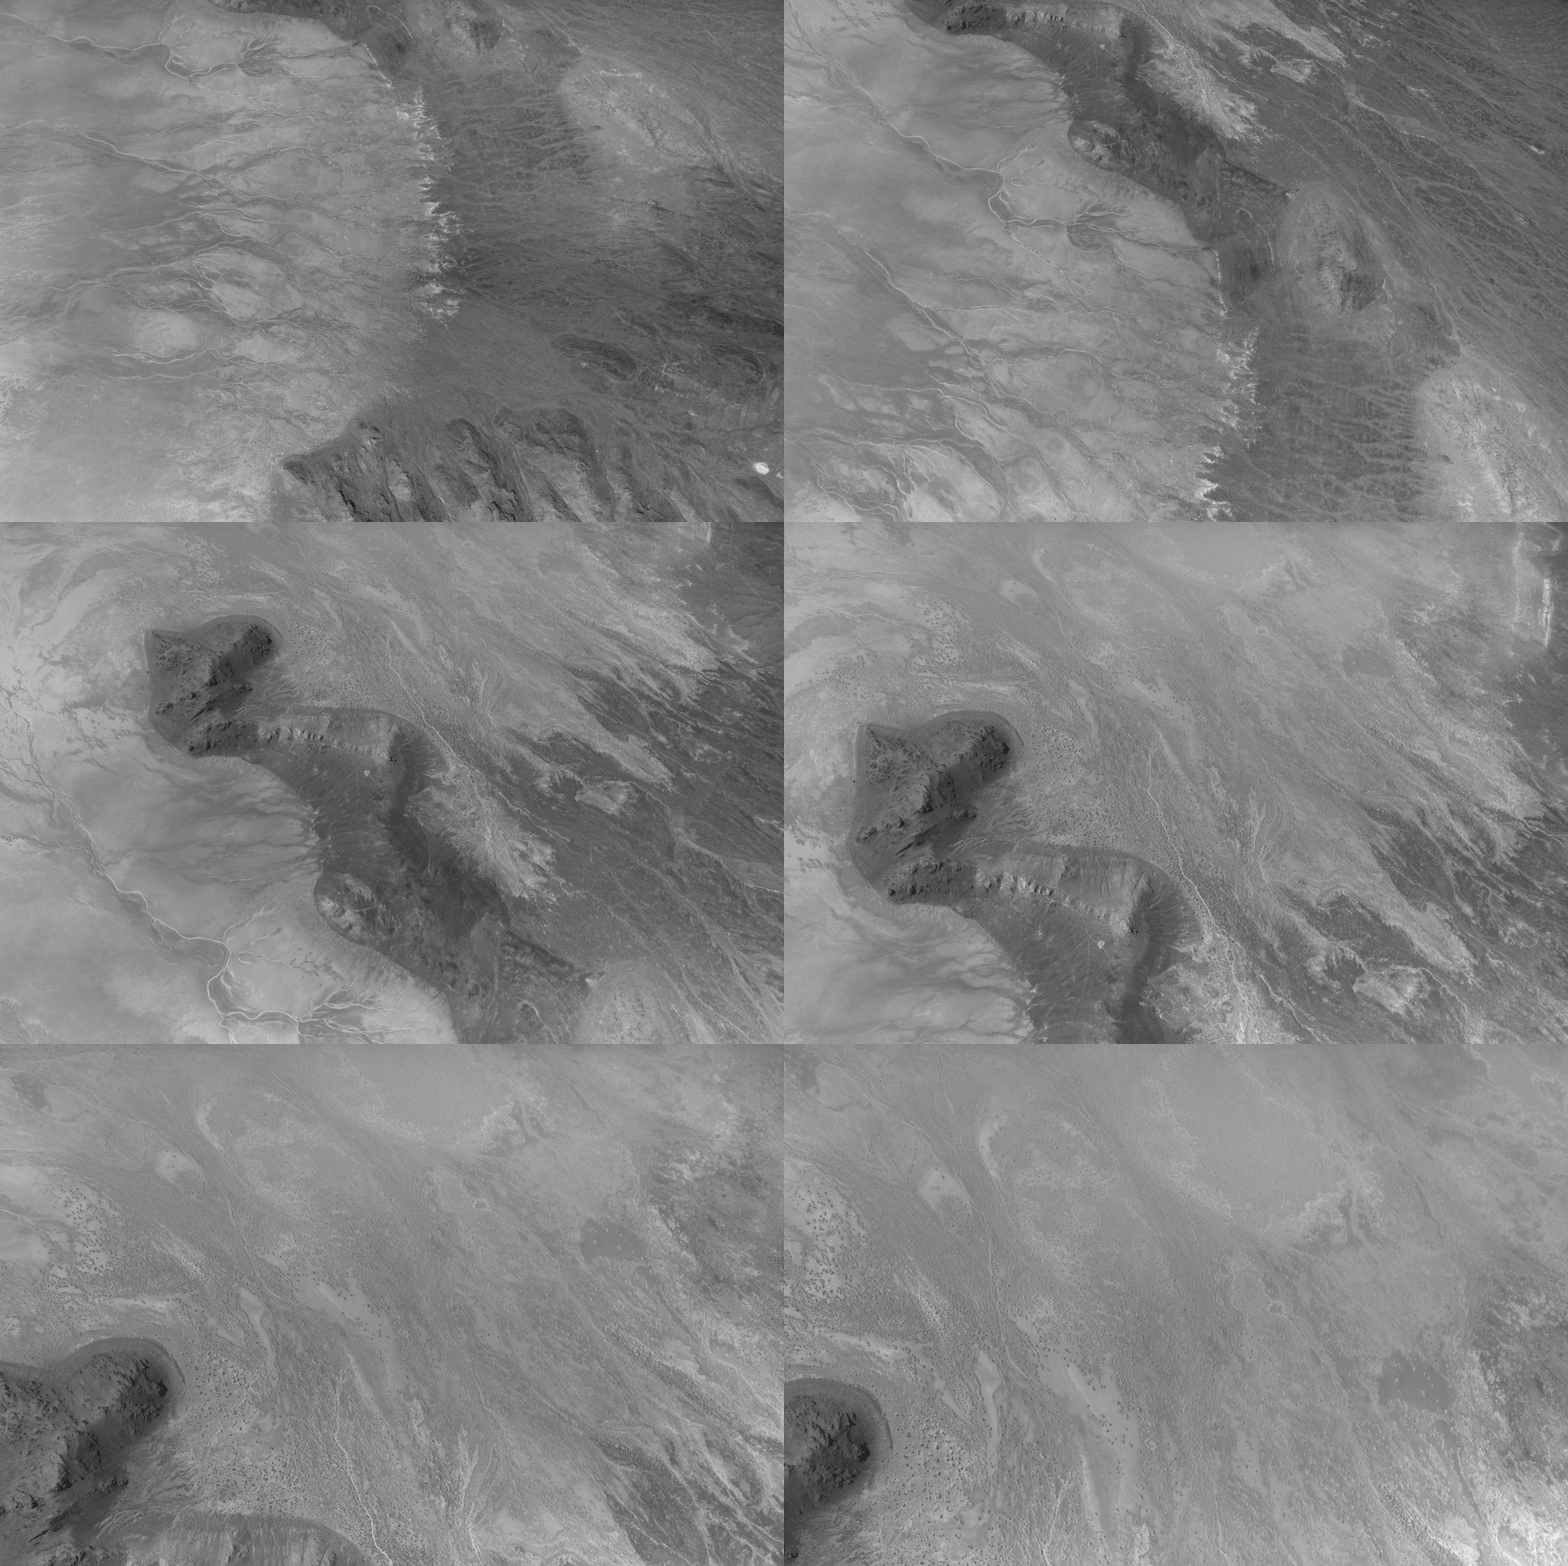
Grayscale aerial image of rugged desert terrain showing branching channels, ridges, and broad textured plains with contrasting light and dark tones.
This animation shows the descent over Crater Island, Utah, of the camera system that will one day fly aboard NASA’s DAVINCI mission to Venus. It was created by stitching together 37 infrared images captured during a test on June 24, 2026.
Malin Space Science Systems/NASA/Jay Friedlander

Mapping geological distinctions like this took center stage in June 2026 when NASA scientists and engineers working with the agency’s DAVINCI mission came to Crater Island—a place they call “Venus on Earth”—to field-test the design of a set of cameras and a package of instruments that will eventually descend through the thick atmosphere of Venus and photograph mountains at scales finer than these Landsat images. During a 60-minute descent, the pioneering probe will capture near-infrared images, measure the atmospheric chemistry, and explore the environment of a world in unprecedented detail.

During the rehearsals at Crater Island, the camera system took hundreds of images of various rock formations, including iron-rich and silica-rich rock units, while suspended from a helicopter as it descended toward the surface. Using only the images acquired by DAVINCI’s camera systems, the team made three-dimensional maps of the area consistent with existing geologic maps, giving the scientists confidence that they will be able to map the geology of an analogous mountainous region on Venus that DAVINCI will study, an area called Alpha Regio.

Other epic adventures have played out on and around Lake Bonneville’s playas, as well. The flat, smooth surfaces have often been the setting for new land speed records. In 1960, Mickey Thompson became the first American to break the 400-miles-per-hour (640 kilometers-per-hour) barrier, hitting 406.60 miles per hour (654.36 kilometers per hour) in a streamlined race car on the Bonneville Salt Flats. The feat temporarily earned him the nickname “fastest man on Earth.”

Straight roads, colorful evaporation ponds, and a long racetrack are visible on bright white salt flats in a satellite image centered east of Wendover.
People mine minerals from the Bonneville Salt Flats and use its flat surface to pursue land speed records. This image was acquired with the OLI (Operational Land Imager) on Landsat 8 on June 4, 2026.
NASA Earth Observatory/Michala Garrison

More recently, in August 2026, Andy Green, the first person to break the sound barrier on land, set a record for the fastest land speed in a hydrogen-fueled internal-combustion vehicle, reaching 406.320 miles per hour (653.909 kilometers per hour). By burning hydrogen rather than gasoline, the “rocket car” produced no carbon dioxide.

Nearly two centuries earlier, in August 1846, members of the ill-fated Donner-Reed Party also passed along the southern edge of Crater Island. As part of a shortcut toward Pilot Peak, they journeyed from Hastings Pass, past Floating Island, and toward Donner Spring. However, in an ominous sign of challenges to come, their heavy wagons broke through the thin salt crust and became mired in underlying mud, slowing them down and prompting them to abandon several wagons in the desert.

NASA Earth Observatory images by Michala Garrison, using Landsat data from the U.S. Geological Survey. Story by Adam Voiland.

References & Resources

You may also be interested in:

Stay up-to-date with the latest content from NASA as we explore the universe and discover more about our home planet.

Farming in Ancient Lake Agassiz

3 min read

The glacial lake left a layer of silt and clay in southeastern Manitoba, creating fertile farmland that was divided during…

Article

Rising Waters Swamp Lake Naivasha

6 min read

Relentless rains are threatening a lake in Kenya’s Great Rift Valley that has become a key hub in the global…

Article

America’s Emerald Isle

3 min read

Beaver Island is one in a string of verdant and scenic jewels in a northern Lake Michigan archipelago.

Article

Source: science.nasa.gov

Posted on Leave a comment

Starstruck: NASA Research Shows How Sun’s Ancient History Shaped Earth

6 Min Read

Starstruck: NASA Research Shows How Sun’s Ancient History Shaped Earth

At the center of our solar system, the Sun influences every planet that orbits it. In two recent NASA-funded studies, scientists uncovered how ancient events in the Sun’s history may have helped create Earth’s unique climate and driven previously unexplained climatic shifts.  

In new research, scientists at NASA’s SHIELD (Solar Wind with Hydrogen Ion charge Exchange and Large-Scale Dynamics) center — one of NASA’s DRIVE (Diversify, Realize, Integrate, Venture, Educate) Science Centers — trace the trajectory of the heliosphere, the massive bubble created by our Sun that envelops our solar system, as it moved through our galaxy and influenced Earth’s climate along the way. In another paper, a NASA scientist and coauthors investigate how the younger, dimmer Sun managed to heat Earth by seeding the production of potent greenhouse gases.

A Sun on the move 

Over the last tens of millions of years, Earth’s climate has undergone significant shifts, including notable ice ages in which the global average temperature temporarily dropped by several degrees. During these periods, more frequent climate swings led Earth to warm and cool. To explain these periods of warming and cooling, scientists looked to factors internal to Earth, including orbital changes, greenhouse gases, and ice. But new research suggests changes to the Sun’s environment may be key to understanding Earth’s temperature swings. 

Just as our planet is encased by an atmosphere, so our entire solar system is encased inside a kind of “atmosphere” created by the Sun. This protective bubble, known as the heliosphere, is formed by a continuous solar wind of charged particles streaming out from the Sun in all directions. 

This conceptual animation begins with a view of the Milky Way Galaxy. As we zoom in, we travel to the Local Interstellar Cloud, and then to the heliosphere, the protective bubble that surrounds our solar system. The heliosphere is formed by a continuous stream of charged particles from the Sun, called the solar wind.
NASA’s Goddard Space Flight Center Conceptual Image Lab

Our heliosphere orbits around the center of our galaxy, the Milky Way. Throughout the Sun’s 4.6-billion-year existence, our heliosphere has traversed various regions within our galaxy. In a paper published on Aug. 21 in Annual Review of Astronomy and Astrophysics, researchers at NASA’s SHIELD used computer modeling to reverse-engineer the path of the heliosphere through our galaxy, revealing that the environments it passed through may have triggered changes on Earth.   

Merav Opher, SHIELD’s principal investigator at Boston University, and her team ran simulations that showed the Sun has encountered frigid expanses of gas and dust at least three different times in the past few million years. In these instances, massive interstellar “cold clouds” pushed against the heliosphere to such an extent that it shrank to smaller than Earth’s orbit, stranding our planet outside the Sun’s protective shield. 

These exposures — approximately 2 to 3 million years, 6 to 7 million years, and 13 to 14 million years ago — would have exposed Earth’s atmosphere to totally different surroundings. The simulation results match geologic evidence: Elements prevalent in interstellar dust appear in deep-sea sediment core samples, Antarctic snow, and lunar samples during these timelines. 

This animated illustration shows Earth and the Sun protected by the heliosphere, the massive bubble created by our Sun. As our solar system traverses through the galaxy, encounters with massive interstellar “cold clouds” pushed against the heliosphere and caused the heliosphere to shrink past Earth, exposing the planet to cosmic radiation and elements from interstellar space.
NASA’s SHIELD DRIVE Science Center/Merav Opher/Harvard Radcliffe Institute

These heliosphere collapse events may also explain ancient climatic patterns on Earth. In the simulations, when Earth’s atmosphere was exposed to a cold, dense galactic hydrogen cloud, it increased water vapor content and shifted upper-atmospheric dynamics, ultimately altering the conditions at the surface. In summary, our heliosphere’s trips through colder regions in our galaxy may be a key factor in driving some of Earth’s ancient changes in climate, including possible ice ages.  

Next frontier in studying heliophysics 

The SHIELD center is one of several that NASA funds to unlock the next generation of heliospheric research. As a DRIVE Science Center, SHIELD builds a team of researchers with differing expertise, approaches, and opinions to develop a model, or “digital twin,” of the heliosphere that helps reveal how the heliosphere interacts with its surroundings, including dense interstellar clouds. Understanding our unique, habitable solar system will help unravel the mysteries of life’s evolution on Earth and potentially uncover other habitable star systems. 

Young Sun 

In another paper, Vladimir Airapetian, a scientist at NASA’s Goddard Space Flight Center in Greenbelt, Maryland, focuses on a long-standing mystery of how the ancient Sun warmed early Earth enough to sustain life. Three billion years ago, the young Sun was 70% as bright as it is today. Under these dimmer conditions, Earth should have been frozen solid. Yet geological evidence shows stable liquid water already existed long before that. This puzzle — a balmy Earth under a cooler, dimmer Sun — is known as the Faint Young Sun paradox.  

One clue to resolving the paradox comes from young Sun-like stars elsewhere in the galaxy. These “toddler” stars are prone to throwing fits. Specifically, data from NASA’s retired Kepler space telescope shows that young Sun-like stars regularly erupt with massive superflares, flinging high-energy particles in all directions on a daily basis. If our young Sun was like these other stars, Airapetian proposes, the barrage of high-energy solar particles could have triggered chemical reactions that were key to warming early Earth. 

Airapetian’s team simulated early Earth’s atmosphere in a sealed chamber, mixing molecular nitrogen, ammonia, carbon dioxide, and carbon monoxide. They then fired protons into the mixture, simulating the onslaught of particles from superflares. This proton bombardment triggered several changes including the production of nitrous oxide, a greenhouse gas 300 times more potent than carbon dioxide. The research was published in Astrophysical Journal Letters.

This nitrous oxide could help Earth hold onto heat. But not all the nitrous oxide would last. The young Sun’s intense ultraviolet radiation would break some of it down, splitting the molecule back into nitrogen and oxygen. But even if only 10% of the nitrous observed in the experiment survived, Airapetian’s team’s computer simulations confirmed, it would still warm Earth’s equatorial regions to about 41 degrees Fahrenheit (5 degrees Celsius), above water’s freezing point. This smaller amount of nitrous could even accelerate prebiotic synthesis: just-above-freezing temperatures have been found to be more efficient for building complex chains of amino acids than warmer temperatures. 

Unearthing secrets of our star-planet system 

Together, these two studies show that the Sun can lead to surprising implications for Earth. While our planet stands alone in many ways, it was formed and has always existed as part of a star-planet system. Understanding that unique relationship promises new insights about both Earth and the star that sustains it.  

By Desiree Apodaca and Miles Hatfield 
NASA’s Goddard Space Flight Center, Greenbelt, Md. 

Keep Exploring

Discover More Topics From NASA

Source: science.nasa.gov

Posted on Leave a comment

Michigan’s Les Cheneaux Islands

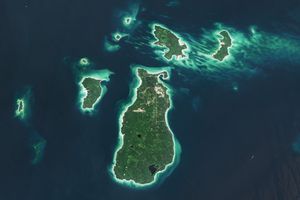
A portion of the Upper Peninsula of Michigan runs across the top of the image. It is mostly green, with some roads and two bright rock quarries visible. Numerous islands near the shore have elongated shapes and are oriented at a diagonal.
The Les Cheneaux Islands are a group of 36 glacially shaped islands near the Upper Peninsula of Michigan, seen in this image acquired with the OLI (Operational Land Imager) on Landsat 9 on July 23, 2026.
NASA Earth Observatory/Lauren Dauphin

With one glance at a particular 12-mile stretch of Lake Huron’s shoreline, it’s clear there’s a pattern. Small islands outlined by tan beaches and bright, shallow water align in a remarkably parallel orientation. The claw-mark-like appearance of this Great Lakes locale is evident in this image, acquired with the OLI (Operational Land Imager) on the NASA-USGS Landsat 9 satellite in July 2026.

The Les Cheneaux Islands are a group of 36 islands near the shore of Michigan’s Upper Peninsula, about 20 miles (32 kilometers) northeast of the Straits of Mackinac. The archipelago contains coastal marshes, rock and sand beaches, peat bogs, and forests full of pine and cedar. Parts of several islands are set aside as nature preserves, including a substantial portion of Marquette Island, which is only accessible by boat or over ice. The islands are interspersed with sheltered waters that inspired their name; the French “Les Cheneaux” roughly translates to “the channels.”

The Les Cheneaux Islands, like many landforms in the Great Lakes region, look the way they do because of glaciers that carved the landscape during the Wisconsin Ice Age before retreating around 10,000 years ago. Their elongated shapes indicate many of them are drumlins: mounds of glacial debris that run parallel to the direction of the ice’s movement. 

The glacial topography has helped give rise to a distinct local maritime culture. In contrast with the Great Lakes’ vast open expanses, the waters around the Les Cheneaux Islands are relatively protected from the infamous storms that can otherwise roil the upper Midwest lakes. This creates opportunities for paddling, as well as fishing in quiet alcoves for species such as smallmouth bass, northern pike, yellow perch, and lake trout. The town of Cedarville boasts an annual antique wooden boat show, a boat-building school, and museums highlighting how people, from the area’s earliest inhabitants to today’s residents, have used the islands and waterways.

On land, the much older geology of the area is revealed in a couple of brightly colored quarries. The bedrock here is dolomite, a modified form of limestone. It was deposited in the Silurian period more than 400 million years ago in a shallow, tropical sea before the movement of tectonic plates brought it up north. Michigan is home to several large dolomite and limestone mines, and Port Dolomite, east of Cedarville, ships millions of tons of the material every year.

NASA Earth Observatory image by Lauren Dauphin, using Landsat data from the U.S. Geological Survey. Story by Lindsey Doermann.

References & Resources

You may also be interested in:

Stay up-to-date with the latest content from NASA as we explore the universe and discover more about our home planet.

America’s Emerald Isle

3 min read

Beaver Island is one in a string of verdant and scenic jewels in a northern Lake Michigan archipelago.

Article

A Tide-Fueled Trove of Biodiversity in Guinea-Bissau

3 min read

The expansive mudflats, sandy beaches, and mangrove forests of the Bijagós archipelago support an array of migratory shorebirds and large…

Article

Shaping the Emerald City

4 min read

The hills and basins of Seattle, Washington, have been sculpted by glaciers and modified by humans.

Article

Source: science.nasa.gov

Posted on Leave a comment

A Changing World for Emperor Penguins


1989
2025

In a satellite image captured in 1989, faint brown guano stains are visible on a background of white fast ice near a cluster of icebergs. The stains are near the edge of an ice shelf to the south.
NASA Earth Observatory/Michala Garrison

In a similar image captured in 2025, brown guano stains are still visible along the ice shelf, though the locations of icebergs.
NASA Earth Observatory/Michala Garrison

In a satellite image captured in 1989, faint brown guano stains are visible on a background of white fast ice near a cluster of icebergs. The stains are near the edge of an ice shelf to the south.
NASA Earth Observatory/Michala Garrison

In a similar image captured in 2025, brown guano stains are still visible along the ice shelf, though the locations of icebergs.
NASA Earth Observatory/Michala Garrison


1989

2025


Landsat has observed evidence of emperor penguins living on Smyley Island in Antarctica as early as 1989. The TM (Thematic Mapper) on Landsat 4 captured this false-color image (left) of guano stains on fast ice on December 24, 1989. The OLI (Operational Land Imager) on Landsat 8 captured a similar scene on December 10, 2025 (right). The images combine observations of infrared, red, and green light to make it easier to distinguish the guano stains. NASA Earth Observatory images by Michala Garrison.

With their charming waddles, heat-conserving huddles, and tuxedo-like plumage, emperor penguins are among the world’s most recognizable animals. Recent satellite surveys estimate that hundreds of thousands of the flightless birds live in 66 colonies spread around Antarctica’s inaccessible, frozen coastlines. But those numbers could fall in the coming decades because emperor penguins rely on landfast (or fast) ice—a type of sea ice attached to the shoreline—to breed, raise chicks, and molt.

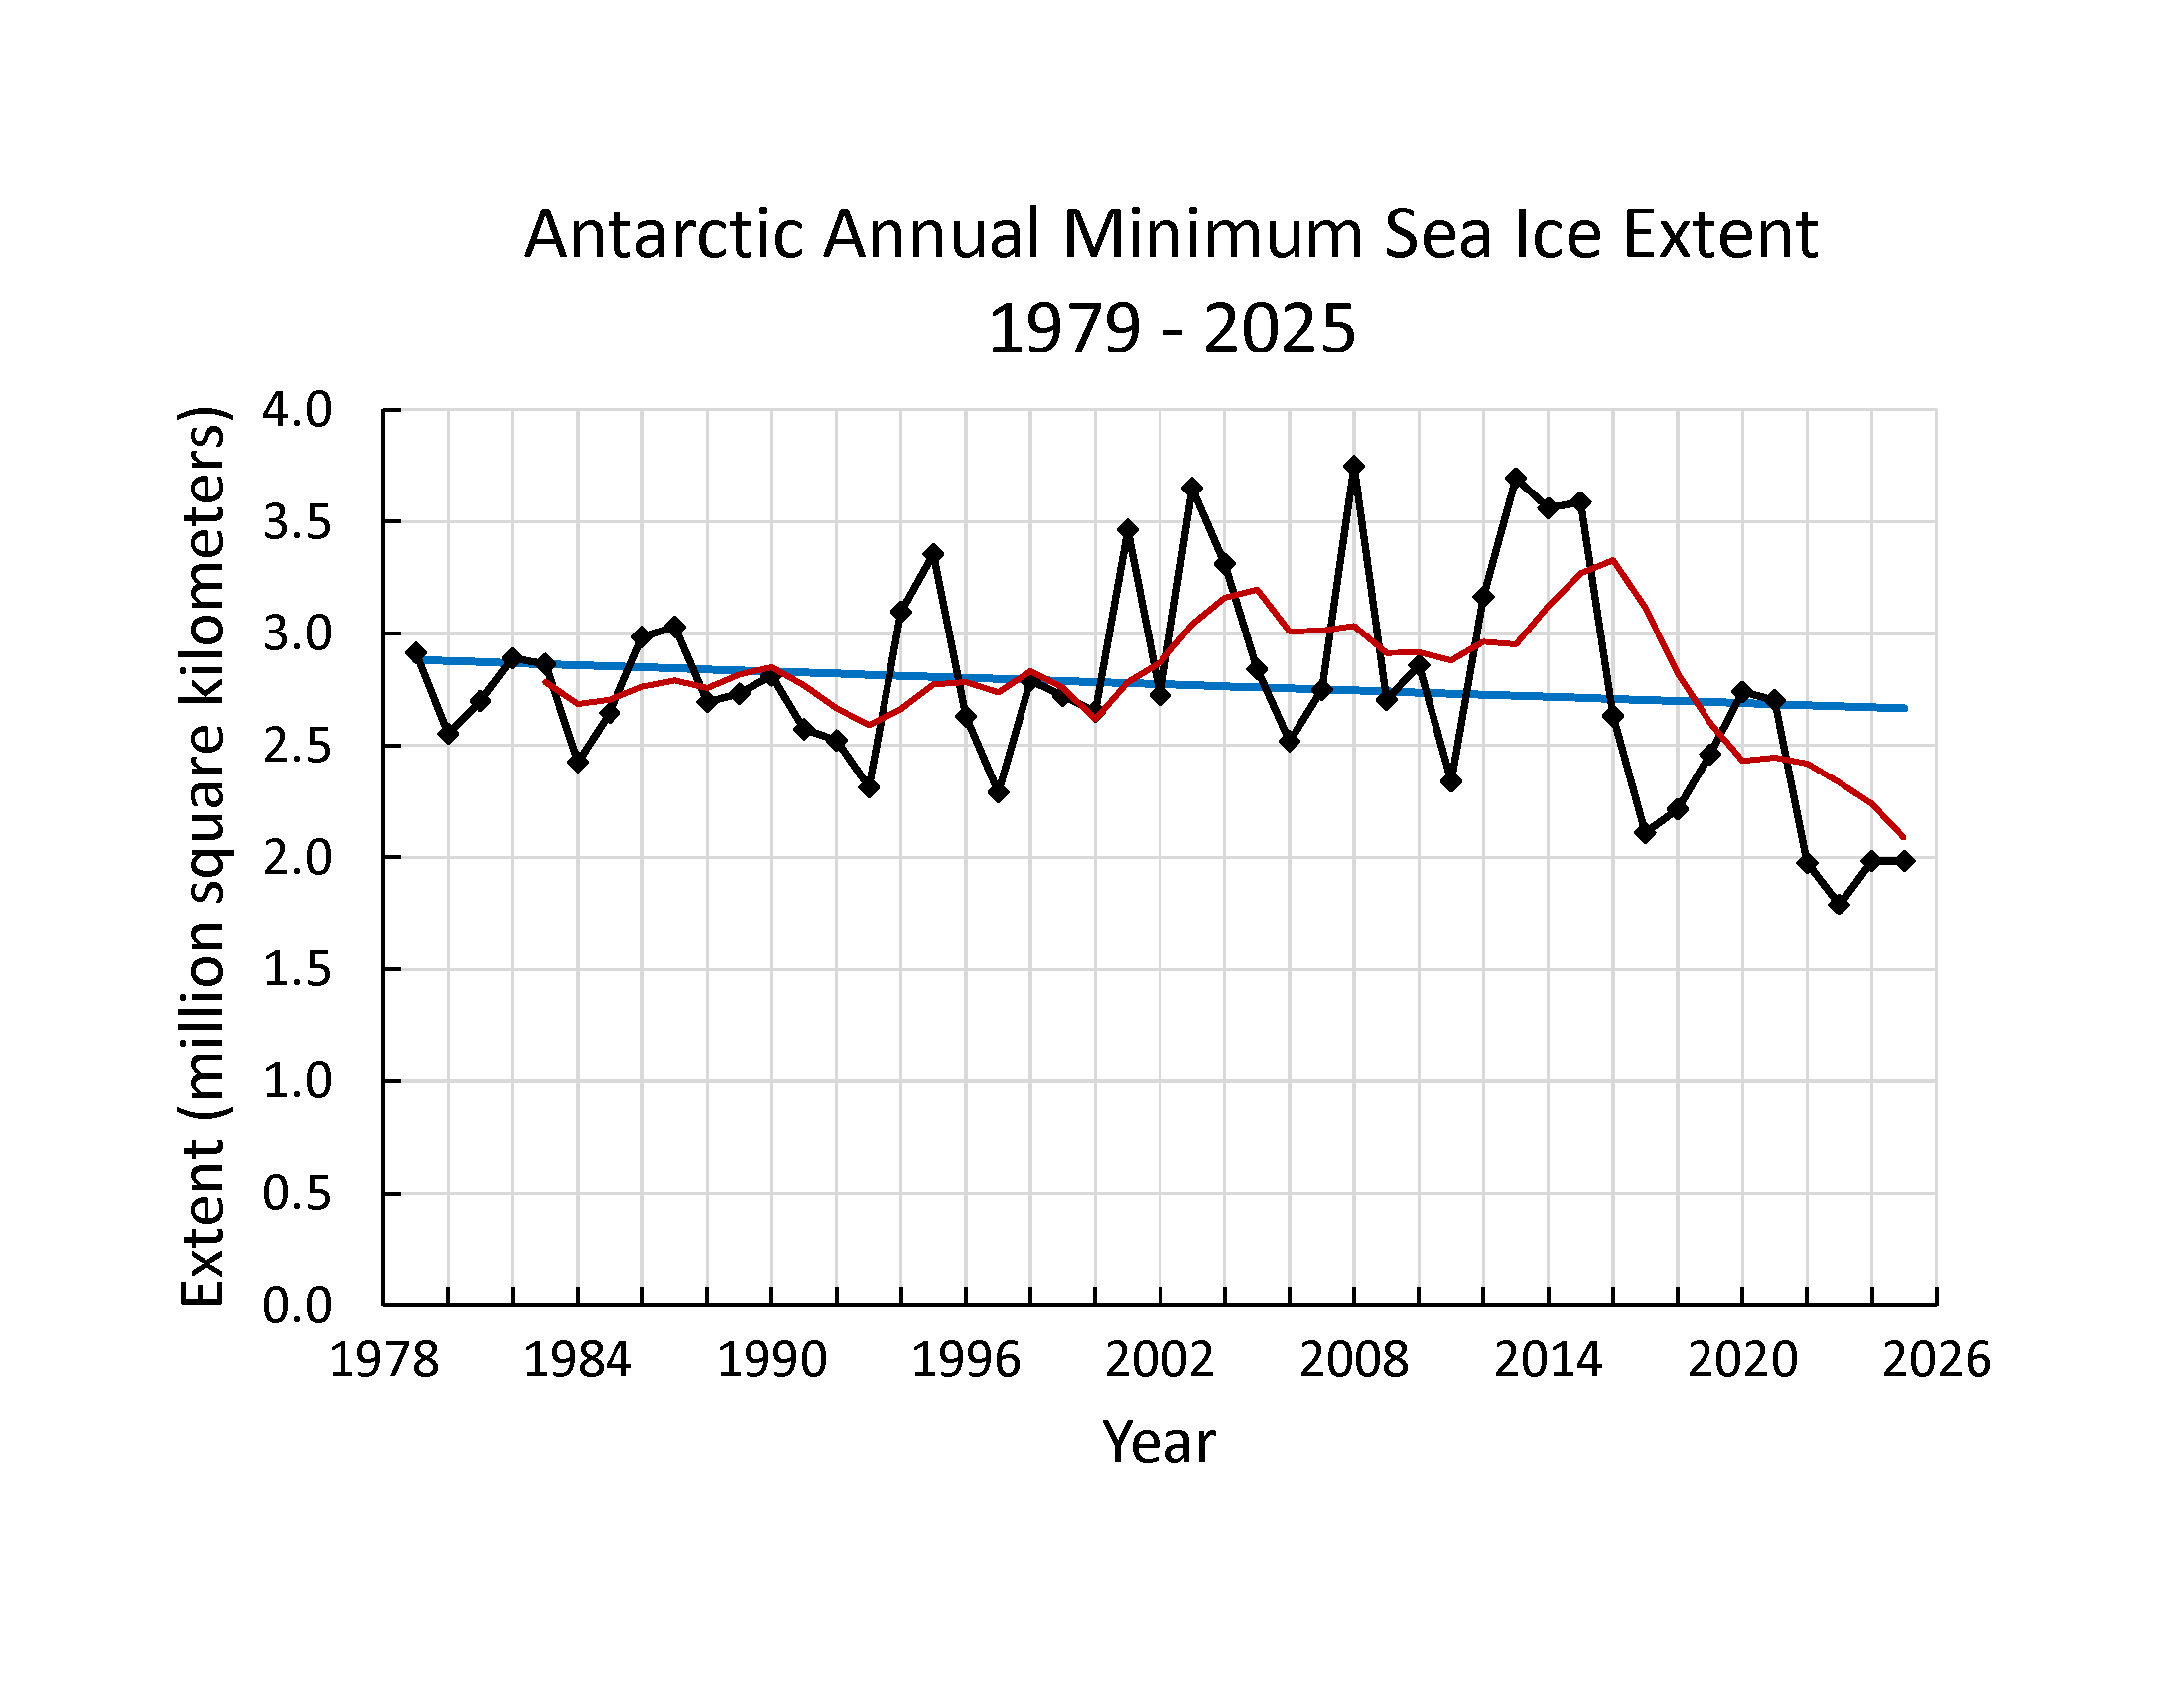
While Antarctic sea ice remained relatively stable between the late 1970s and 2015, it has been declining since 2016, and climate projections suggest that trend will continue. How landfast ice is faring remains poorly understood and is an active area of study. However, one study suggests that it has declined in West Antarctica and the Weddell Sea in recent decades even as it has trended upward in the Bellingshausen Sea and East Antarctica.  

Meanwhile, some models project that emperor penguins could disappear by 2100 due to their habitats becoming inhospitable. The U.S. Fish & Wildlife Service listed emperor penguins as threatened in 2022, and the International Union for Conservation of Nature classified them as endangered in 2026.

After Antarctic sea ice cover hit a record low in 2022, British Antarctic Survey researchers reported “catastrophic” breeding failures among Bellingshausen Sea colonies. However, new research, based on decades of observations from NASA-USGS Landsat satellites, offers some hope, underscoring that many colonies have persisted for decades and that emperor penguins may be more flexible about where they breed than previously thought.

Except for a few well-studied colonies, scientists have known little about how long many emperor penguin colonies have existed, how their populations have changed, or how they have responded to past disruptions in landfast sea ice.

Three adult penguins with black-and-white plumage are surrounded by several younger penguins with fuzzy gray plumage.
Adult and juvenile emperor penguins congregate on sea ice in Antarctica.
Michael Van Woert, NOAA NESDIS, ORA

“There’s little baseline information for what’s ‘normal’ for most of these colonies,” said Michelle LaRue, a wildlife ecologist at the University of Canterbury. That’s made projecting future population levels a challenge.

Two new studies published in 2026 used decades of Landsat observations to start filling gaps in understanding. Landsat cannot resolve individual penguins, but researchers identify colonies from the guano stains that accumulate where thousands of birds congregate on the ice.

Using this technique, researchers at the University of Freiburg found that 18 colonies predate their initial identification by an average of 17 years. Because Landsat has imaged Antarctica continuously since the early 1980s, it provides one of the few systematic long-term records of remote penguin colonies.

Among the oldest colonies studied was the roughly 6,000-bird Smyley Island colony in the Bellingshausen Sea, which dates to at least 1989, two decades earlier than previously known. Other colonies that predated their earliest known presence by 20 or more years included those at Barrier Bay, Brownson, Luitpold Coast, Ragnhild, Smith, and Verdi Inlet.

Scientists have watched the Smyley Island colony closely in recent years because it is among the colonies that may have suffered a total breeding failure in 2022. Satellite images captured that year show the colony splitting up, with some penguins moving onto a large iceberg grounded near the coast.

Despite persistently low sea-ice conditions since then, the colony has continued to appear in satellite imagery, generally establishing itself near icebergs along the edge of the ice shelf. The image above on the right shows the colony in December 2025, the most recent month Landsat has observed the colony.

“We’re seeing a degree of resilience in the Smyley Island colony,” LaRue said. “They seem to be doing okay now, and we will continue to monitor them to learn more about their behaviors.” The colony’s persistence underscores that one bad breeding year—even a total failure—doesn’t mean the end of a colony. Blizzards and predators can lead to bad years with very low chick survival rates as well, she added. “It’s when we start to see frequent breeding failures year after year that the birds won’t be able to keep up, and it starts to be a problem for a colony.”

An image (left) shows a long trail of guano extending from rift ice northward to a larger guano stain on a nearby ice shelf in 2018. In 2023, brown guano stains are visible on fast ice much closer to open water, while there is no sign of the penguin colony on the ice shelf (right).
Landsat 8 captured an image of the SANAE colony with a guano trail leading from rift ice to the ice shelf on January 23, 2018 (left). On January 4, 2023, the birds had returned to their original fast ice area (right). The images combine observations of infrared, red, and green light to make it easier to distinguish the guano stains.
NASA Earth Observatory/Michala Garrison

A second study, led by Grant Macdonald, a remote sensing scientist at Durham University, found further evidence of behavioral flexibility. Macdonald and colleagues analyzed nearly 40 years of observations from Landsat, the ASTER (Advanced Spaceborne Thermal Emission and Reflection Radiometer) on NASA’s Terra satellite, and other sources for three colonies disrupted by iceberg calving or early sea ice breakup. They found that penguins of the Mertz and SANAE colonies responded by temporarily shifting to nearby icebergs, embayments, or ice shelves before returning to their former breeding sites.

Landsat first imaged the SANAE colony in 1984 on fast ice in a sheltered bay in the Queen Maud Land region in East Antarctica. After a major calving event in 2011 exposed the fast ice to more punishing winds, the colony relocated to rift ice in an embayment 11 kilometers (7 miles) to the south. The move proved temporary. Part of the group moved to another nearby site, and part of it returned to the original breeding location in 2016.

Yet in the 2016–2017 breeding season, the returnees did something unexpected. Despite the presence of stable fast ice, they trekked onto the ice shelf and huddled and bred there. In the Landsat image above, a winding guano-stained trail traces the penguins’ route onto the ice shelf. By 2022, after roughly a decade of wandering and splitting between sites, the entire colony had returned to its original breeding ground on the fast ice, where it has bred each year since.

At the third colony the researchers studied, the Astrid colony on the Vigridisen Ice Shelf, the birds kept returning to their original breeding location even after a major calving event in 2006. That’s likely because some fast ice remained and nearby icebergs provided some shelter. The guano stains indicate that the colony did, however, sometimes spend time on a nearby ice shelf toward the end of the breeding season both before and after the calving event.

Indeed, moving and sometimes breeding on alternative surfaces such as ice shelves, icebergs, or rift ice may be “more common and feasible than previously thought,” Macdonald said, perhaps because some sites offer better shelter from wind. This willingness to move may represent a “useful adaptation” as ocean temperatures warm and sea ice declines, he added, though he cautioned that behavioral flexibility alone won’t necessarily offset the long-term effects of continued sea-ice loss.

“We have so much more to learn about emperor penguins,” added LaRue. “These colonies are so remote and difficult to access that satellites—especially government satellites with easily accessible data—are going to be absolutely invaluable to understanding what the future will bring for them.”

NASA Earth Observatory images by Michala Garrison, using Landsat data from the U.S. Geological Survey. Photo by Michael Van Woert (NOAA NESDIS, ORA). Story by Adam Voiland.

References & Resources

You may also be interested in:

Stay up-to-date with the latest content from NASA as we explore the universe and discover more about our home planet.

Pink Penguin Guano Provides Diet Clues

3 min read

The color of Adélie penguin droppings reveals what the birds are eating, offering scientists a way to track how sea…

Article

Record-Setting Retreat of Hektoria Glacier

5 min read

Scientists relied on satellite data to understand how the Antarctic glacier lost so much ice so rapidly.

Article

An Uncommon Drifter in the Denmark Strait

4 min read

A large iceberg, observed in summer 2026, had drifted more than 1,000 kilometers south from the northeastern Greenland bay where…

Article

Source: science.nasa.gov

Posted on Leave a comment

Building Foresight for Earth Science, featuring Lindsey Jacobson

NASA’s Earth-observing satellite missions track dozens of features of a changing planet — aerosols, sea levels, land cover, cloud cover — over years and decades. Sustaining that record for the scientific and operational communities who depend on it requires more than engineering talent. It requires planning for an uncertain future: anticipating where a mission delay or on-orbit event might create a gap in the data those communities rely on.

Lindsey Jacobson’s work helps NASA anticipate those disruptions before they happen and gives senior leaders options for managing them.
A Pathways intern in engineering, Jacobson supports NASA’s Earth Science Division through the NASA Earth Science Strategic Integration Environment (NESSIE) team within the Systems Analysis and Concepts Directorate (SACD) at NASA’s Langley Research Center in Hampton, Virginia.

NASA’s Pathways program connects undergraduate and graduate students with NASA centers through internships that, with satisfactory performance, can lead to full-time civil service positions. Jacobson has returned to NASA Langley every summer since 2022, splitting her time between the center and finishing her mechanical engineering dissertation at North Carolina State University.

Lindsey Jacobson, NASA Pathways intern, at NASA Langley Research Center
Lindsey Jacobson, Pathways Intern
Credit: NASA


“The way we do Earth science is changing.


The Problem Space

Jacobson and the NESSIE team support the Earth science satellite portfolio — dozens of missions, each measuring specific features of the planet, from clouds to sea surface temperature to land use. The goal is providing end user communities with the data products they depend on. The challenge is the unknown.

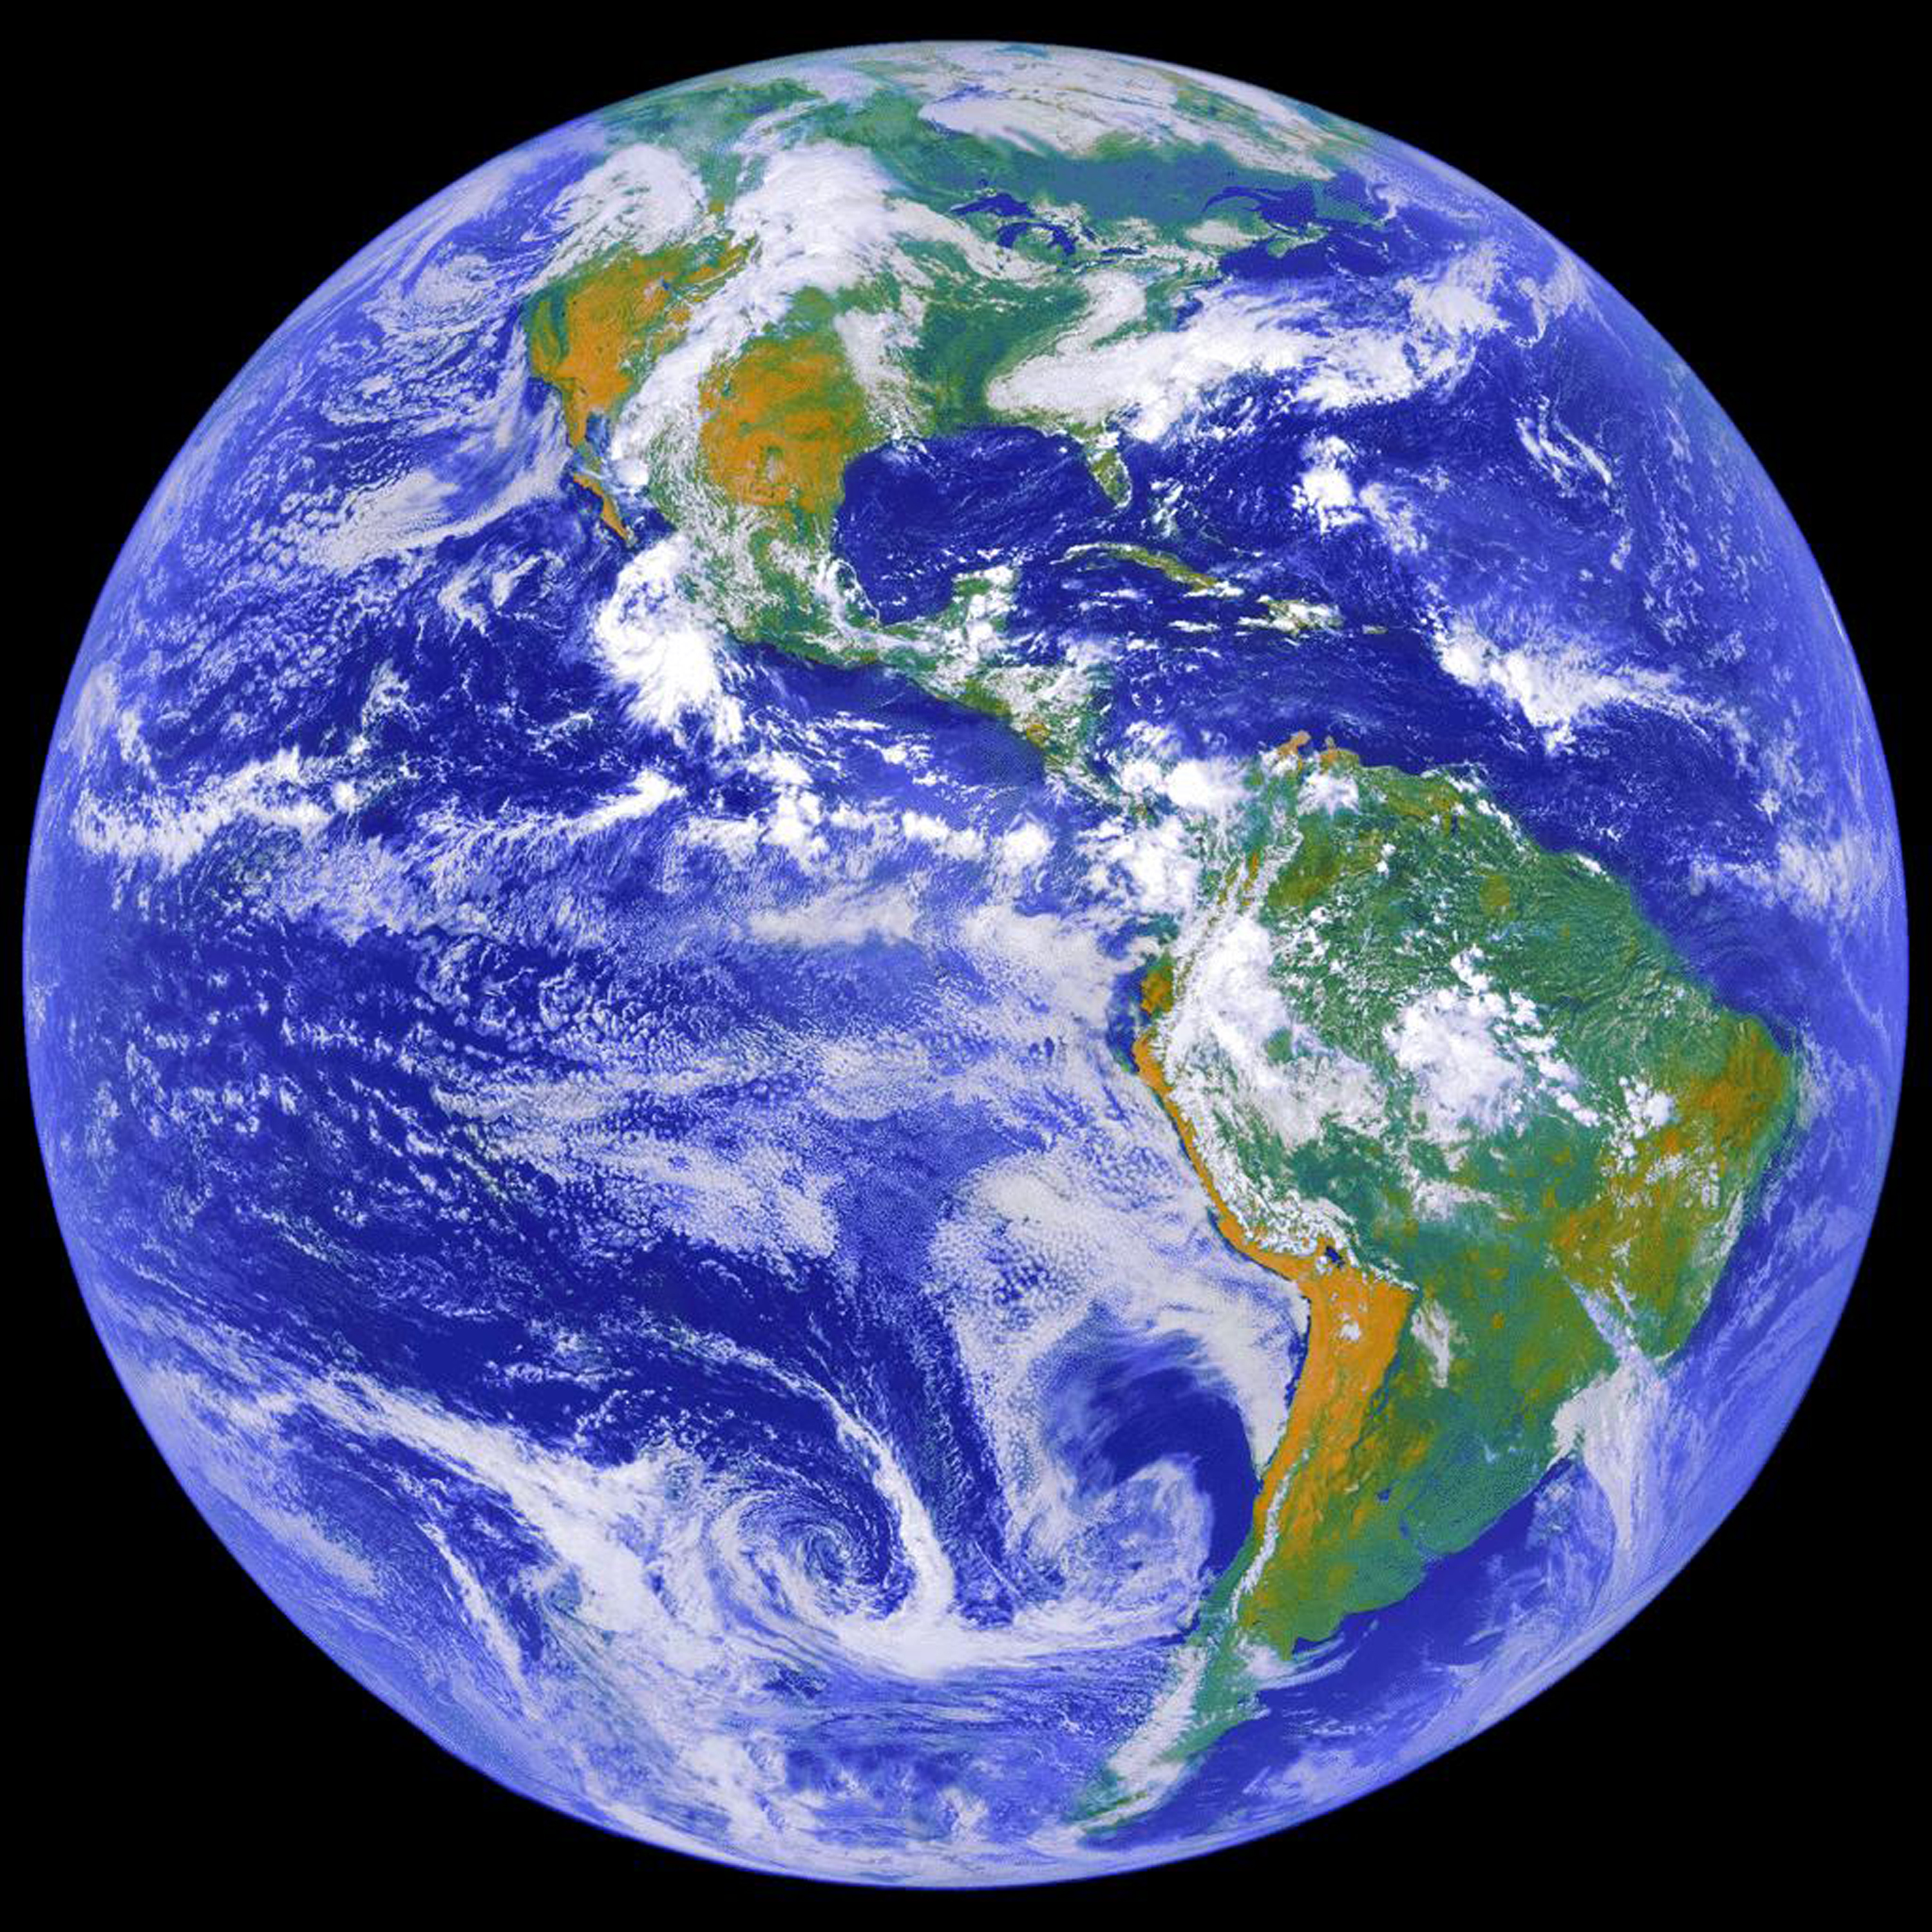
Full-disk image of Earth captured by NOAA's GOES-8 satellite, which operated from 1994 to 2004
This image depicts a full view of the Earth, taken by the Geostationary Operational Environment Satellite (GOES-8), a satellite that was in service from 1994-2004. It was owned and operated by the National Oceanic and Atmospheric Administration (NOAA) and provided the kind of continuous monitoring necessary for intensive data analysis.
Credit: NASA

“There’s uncertainty about mission lifetimes and what could happen on orbit, and about schedules,” Jacobson explains. The team’s work gives NASA’s senior leadership a way to navigate that uncertainty: understanding where a gap in coverage might emerge and identifying options to mitigate or hedge against it. By providing alternative pathways for meeting end-user needs, this work supports senior leaders in managing a complex, interdependent portfolio.

Writing the Code

Within that effort, Jacobson’s focus is building analysis tools that give the team what she calls a “foresight ability.”

“It’s the ability to anticipate different things that might happen — changes that might occur across the portfolio of Earth-observing missions — and to have strategies in mind for how to respond, so we can keep delivering data to end users,” she says.

Not every change is bad news. Missions sometimes operate well beyond their planned lifespan, creating room to extend their value. But whether an adjustment is welcome or not, the principle is the same: know the options before anything happens.

Jacobson compares it to preparing for hurricane season. “You get the storm shutters, you buy the sandbags, and you have them pre-positioned,” she says. “Then when the warning comes, you’re not scrambling, and you’re not at risk of the store selling out. You already have what you need in place.” NESSIE’s work follows the same logic for the Earth-observing portfolio by understanding ahead of time what a disruption might mean and having a set of responses ready before anything happens.

“We proactively suggest the strategies and alternatives that could be enacted if there’s a change,” Jacobson says. “We do that ahead of time, so people understand what options might exist.”

Her approach carries echoes of her graduate research, which examines how complex systems — infrastructure that can’t simply be torn down and rebuilt, like the electric grid — must evolve deliberately instead. “We designed a grid, and now we live with that grid forever,” she says. “We can’t tear it down and build a new one. What we can do is modify, expand, and improve upon what we have.” It’s the same instinct for working with what exists, rather than starting from scratch, that shapes how she approaches her work at NASA.

Keeping Pace

Engineers arriving at NASA for the first time might expect the hardest part of the job to be technical. Jacobson found something else: the landscape itself is what demands the most adaptability.

“The way we do Earth science is changing,” she says. Commercial companies are increasingly contributing data alongside government agencies. New space agencies are entering the field. Innovative technologies and architectures are emerging all the time. Keeping pace with that shift — understanding how NASA’s own capabilities are evolving and how to best serve the communities that depend on the data — is as much a part of the job as any calculation.

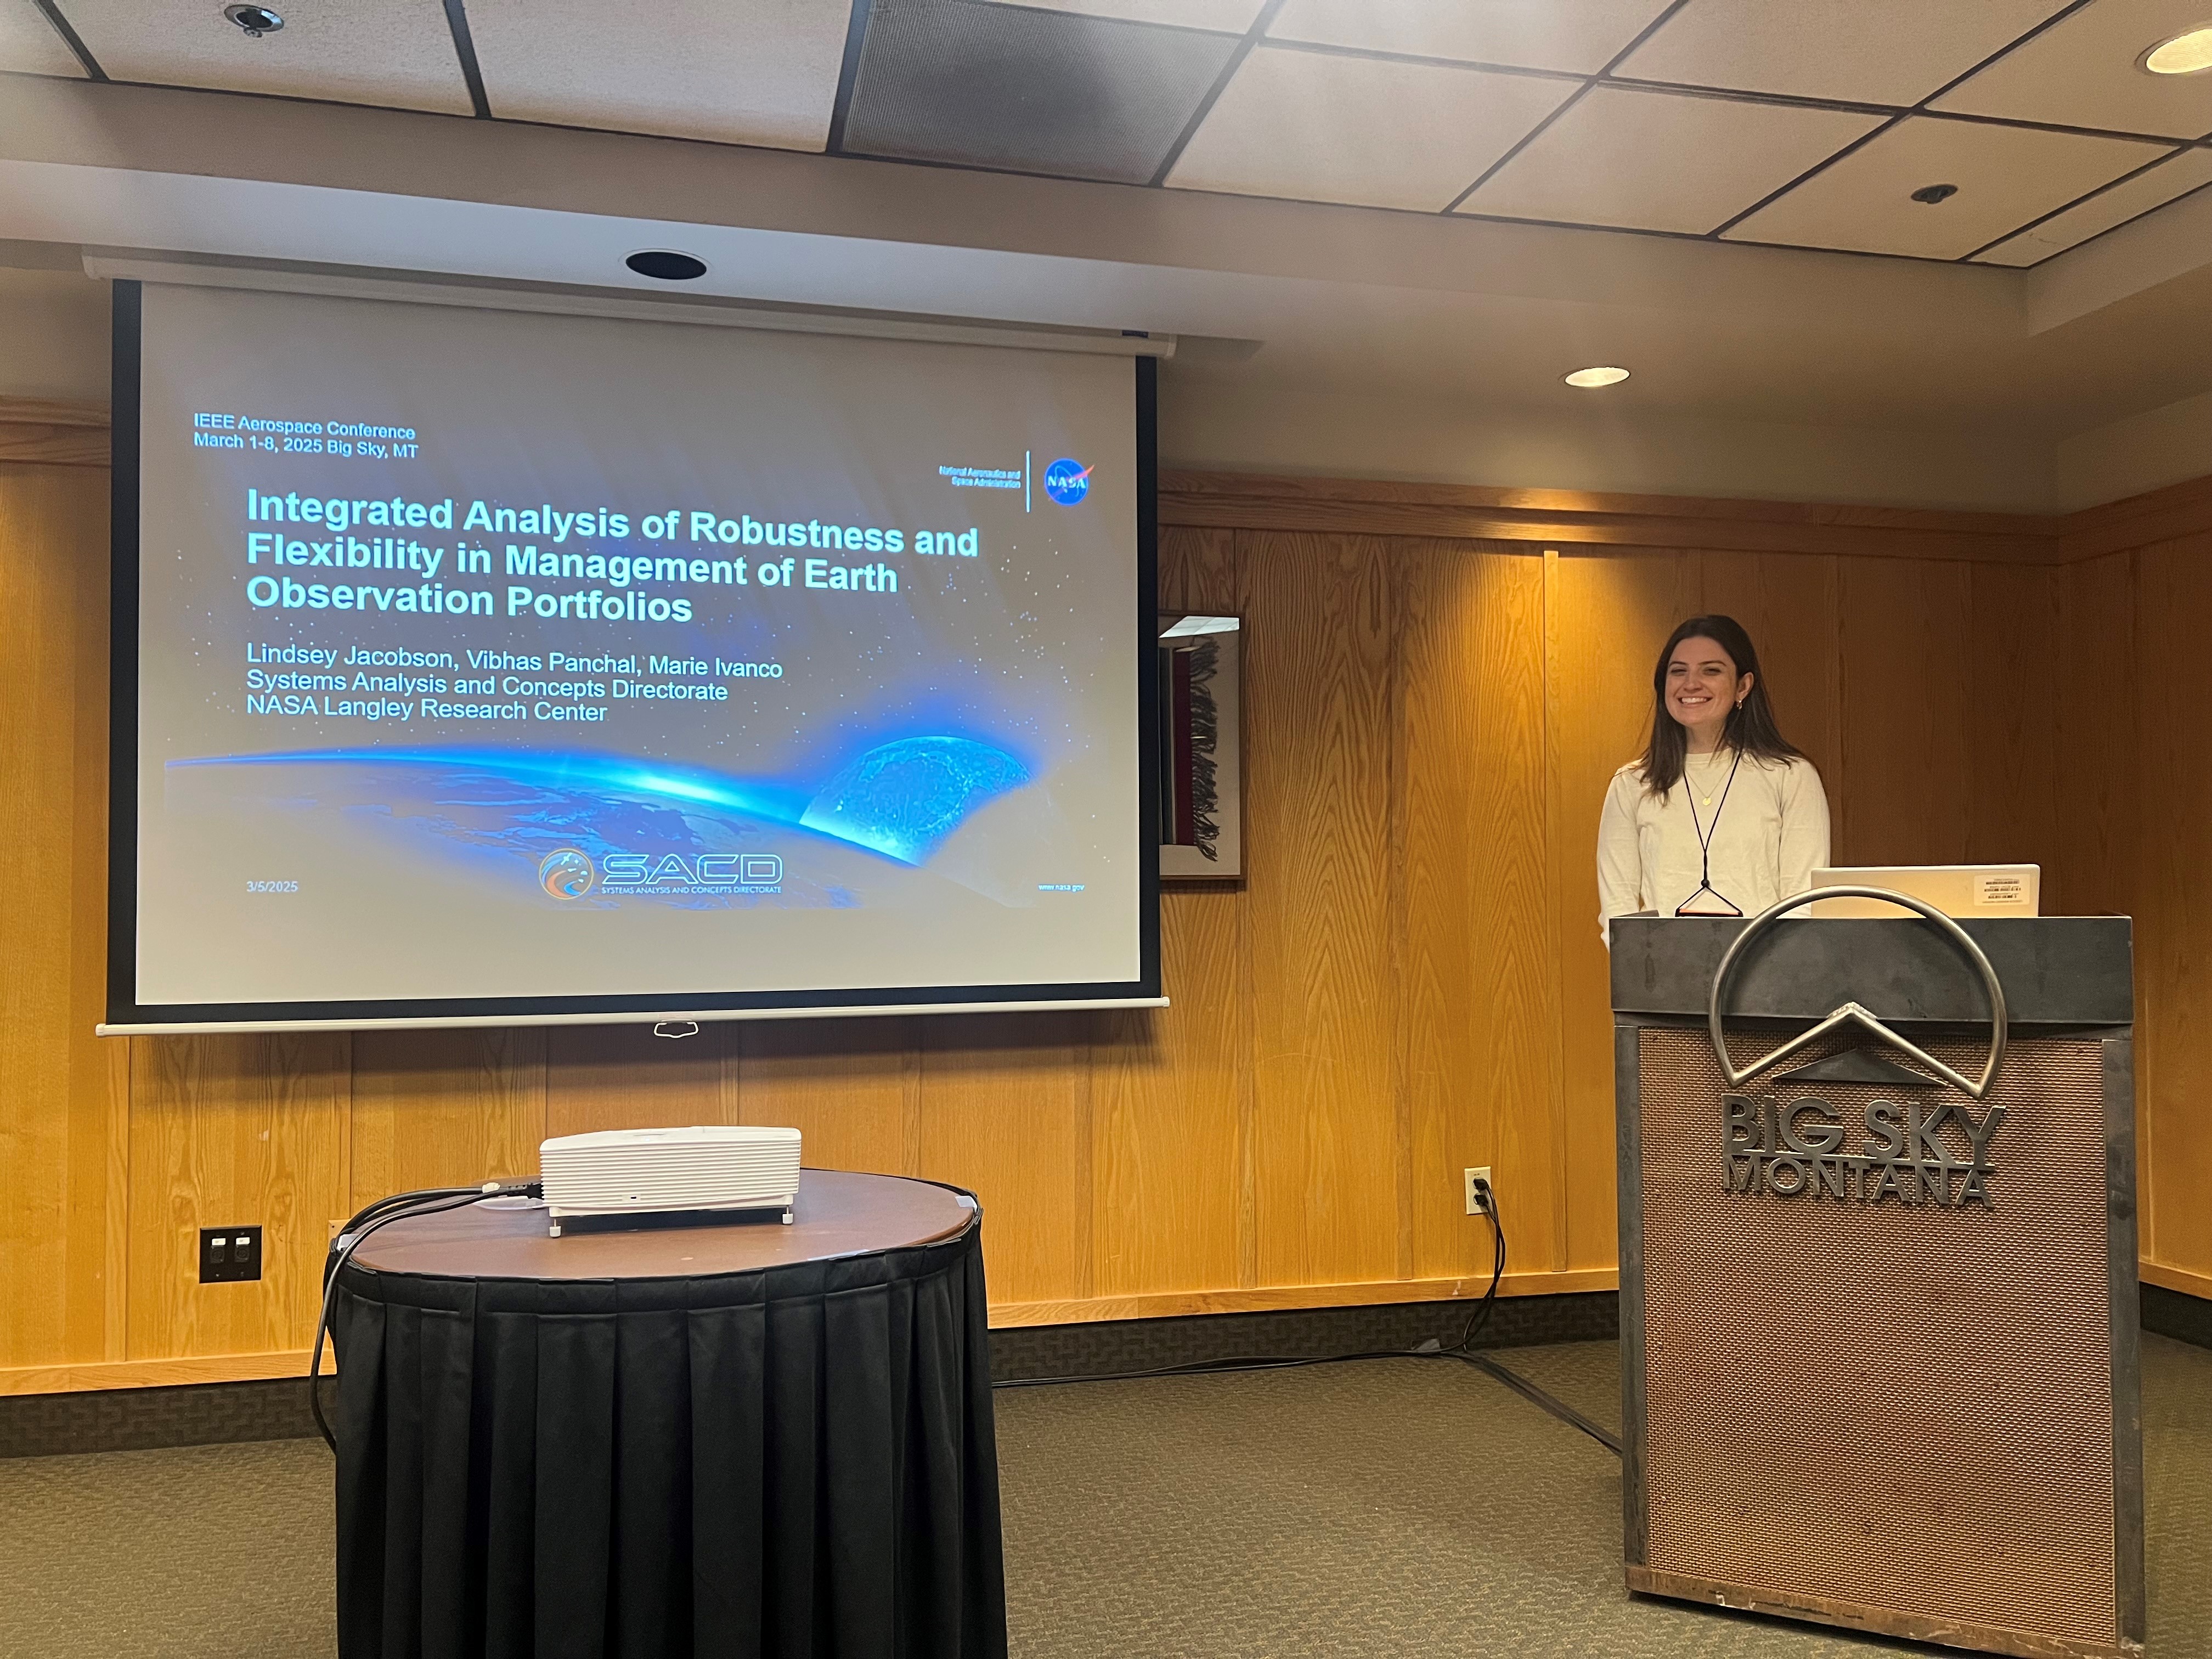
Lindsey Jacobson presents NESSIE's work on managing Earth-observing mission portfolios at the 2025 IEEE Aerospace Conference
Jacobson presenting NESSIE’s work on managing portfolios of Earth-observing missions to meet science needs despite uncertainties in mission scheduling and lifetimes, Institute of Electrical and Electronics Engineers (IEEE) Aerospace Conference, 2025.
Credit: NASA

Some of that adaptability shows up in smaller ways too, like the growing role of AI tools in her team’s own workflow. “Langley has done a lot of firsts,” Jacobson says, echoing something she heard recently from Trina Dyal, NASA Langley’s director, at an intern event. “And we want to continue to be the first. That means learning new things and figuring out how to bring them into how we work.”

On Jacobson’s Sci-Fi Shelf

The Sirens of Titan by Kurt Vonnegut

Jacobson received this novel in high school, let it sit on her shelf for years, and finally picked it up during the pandemic.

“It was very special. It touches a lot on the meaning of life, and that connects to some of the reasons I was motivated by space in the first place. The idea that space exploration can bring humanity together. That cosmic perspective.”


Part of the Systems Analysis and Concepts Directorate at NASA’s Langley Research Center.
Learn more about our work by visiting our website.

Source: www.nasa.gov